Website performance is a measure of how fast, interactive, and easy to use your site is.
And better performance often leads to better business results.
Before we get into how to improve your website’s performance, let’s cover some of the specifics of why strong performance matters in the first place.
Why Is It Important to Improve Website Performance?
A speedy website with a smooth user experience (UX) helps keep visitors on your pages longer and increases the likelihood of them completing conversions (taking desired actions) like making a purchase or signing up for a newsletter.
Plus, pages that load more quickly and provide a better UX tend to perform better in search engine rankings. Which helps more people discover them.
That’s because both page experience and page speed (among other criteria) are Google SEO ranking factors.
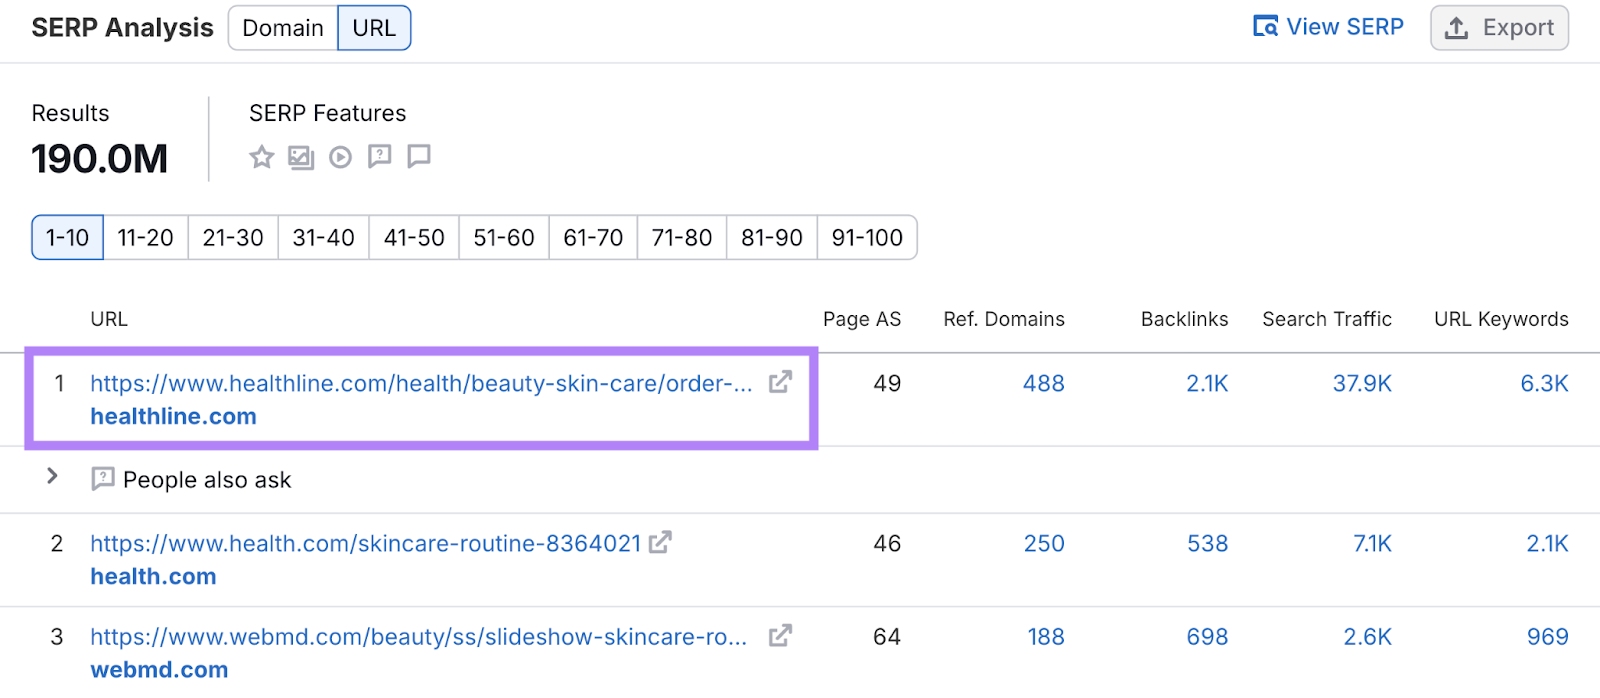
For example, let’s consider the top-ranking result for the query “skincare routine”—a term Keyword Overview shows is highly competitive and gets over 22K searches per month in the U.S.
If we scroll to the bottom of the report, we can see that Healthline has the page at the top of the search engine results page (SERP).
Google’s PageSpeed Insights tool (we’ll cover this in more detail later) indicates this is a fast-loading page.
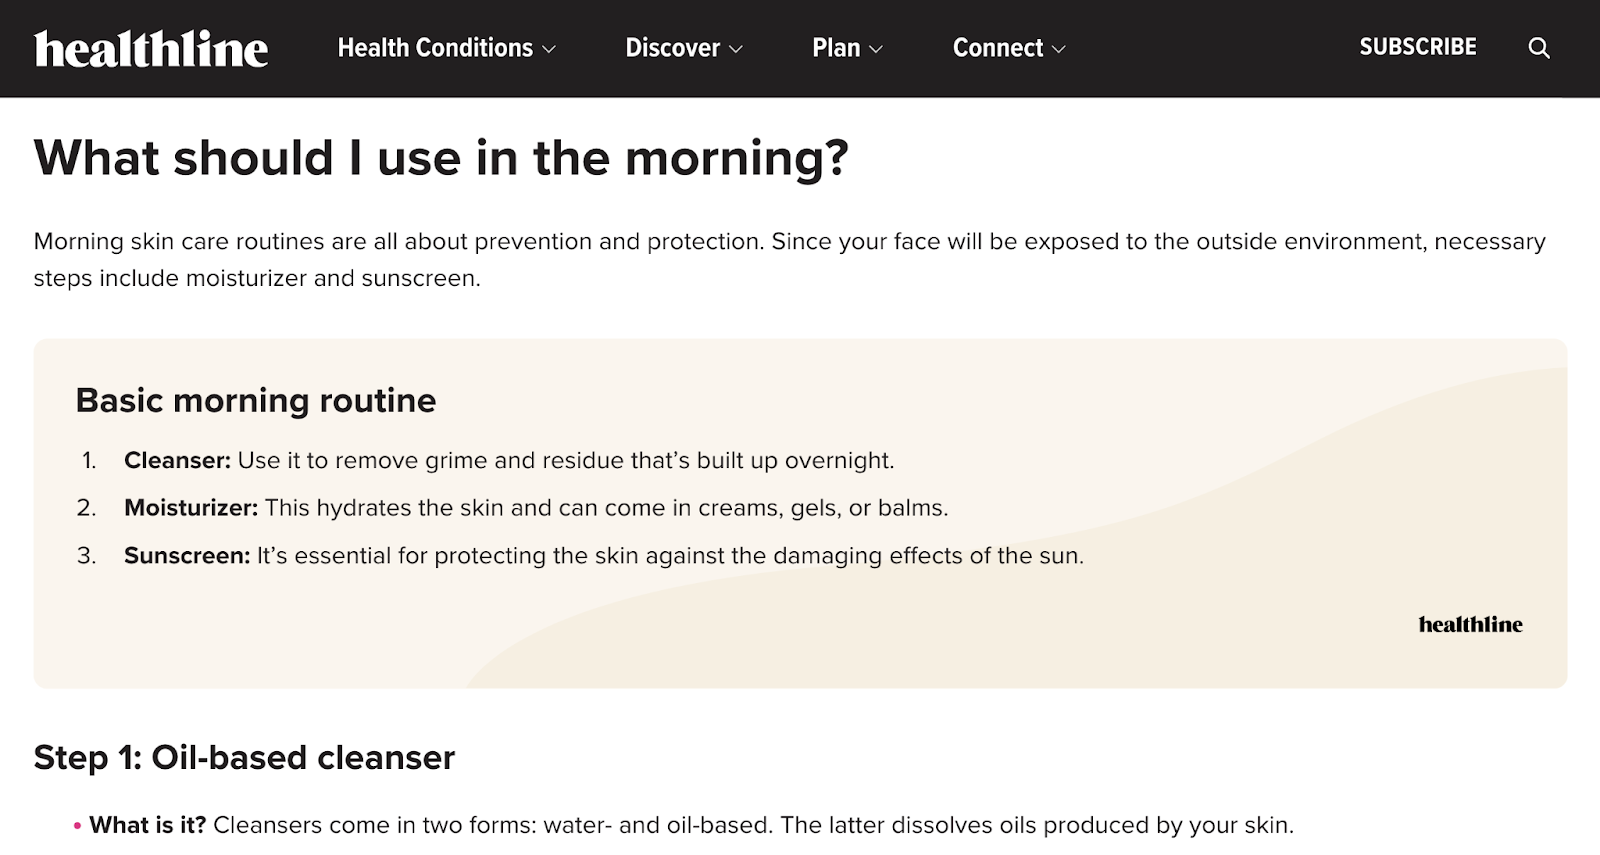
And if we look at the page ourselves, we can see that it has simple navigation, clear fonts, well-placed visuals, and a clean layout that enhances readability.
While great performance isn’t the only thing that affects high rankings, improving it can still give you an edge in search visibility.
So what exactly goes into a high-performing site? Let’s look at that next.
What Affects a Webpage’s Performance?
Many factors can impact a webpage’s performance (we’ll go over specifics when we get to the tips). But it’s worth specifically discussing speed.
And you can use the Core Web Vitals as your primary guide for this.
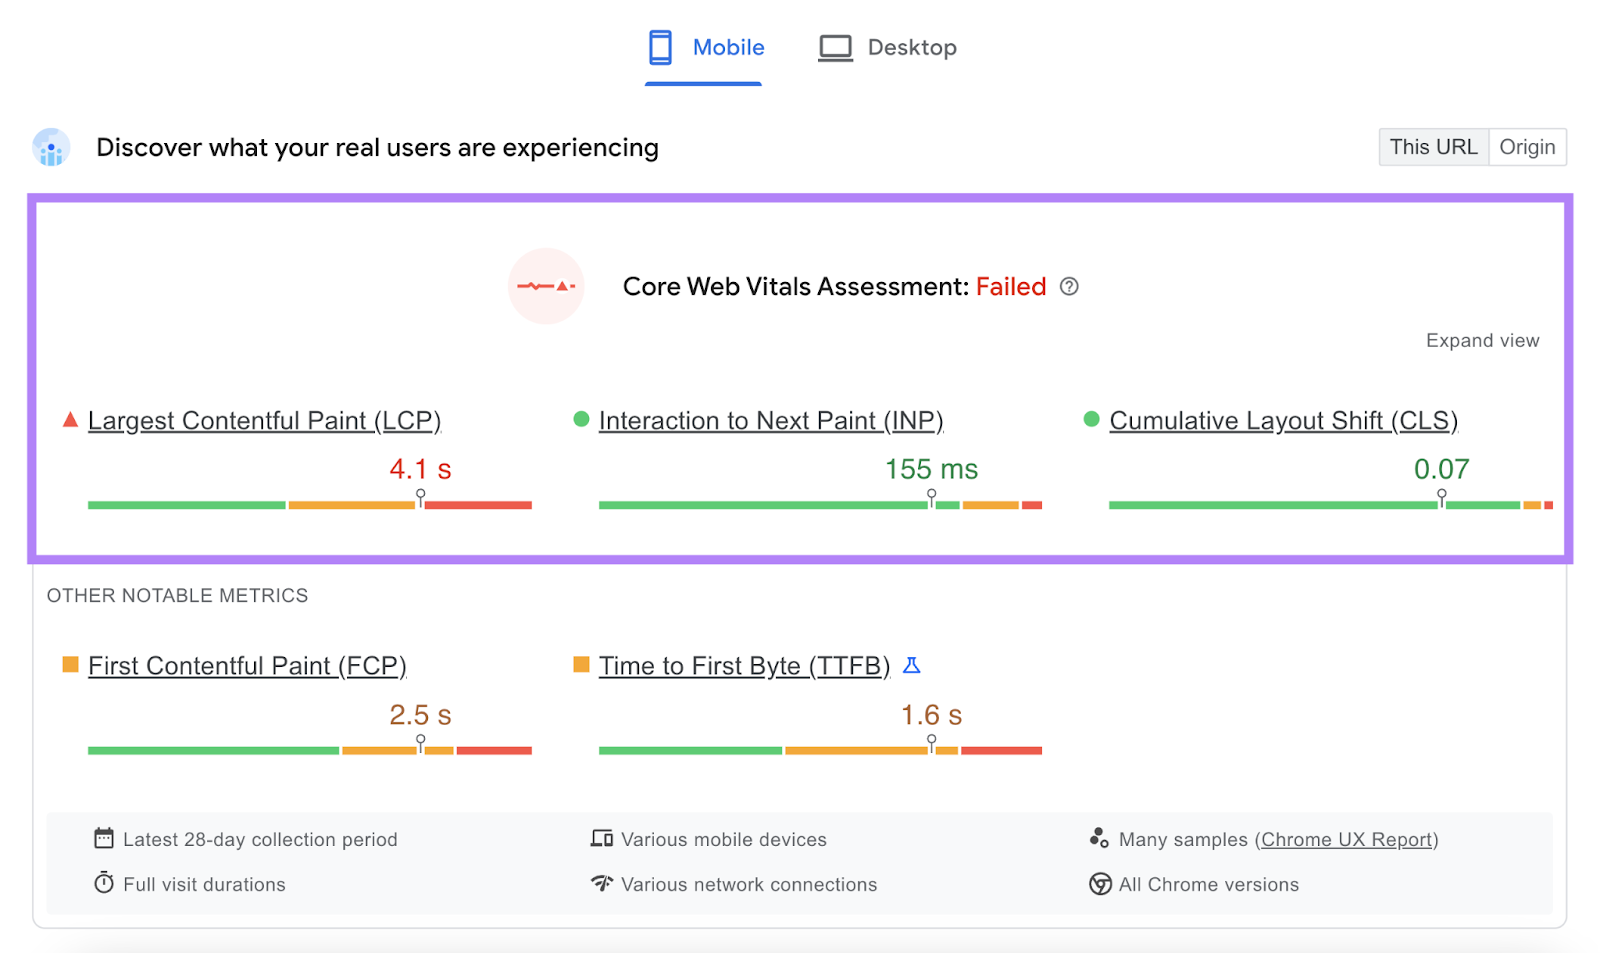
The Core Web Vitals are a set of three metrics that measure how users experience a website:
- Largest Contentful Paint (LCP): Measures how long it takes for the largest content element on the page to load
- Cumulative Layout Shift (CLS): Measures how much the page’s layout moves around unexpectedly during loading
- Interaction to Next Paint (INP): Measures the longest delay a user experiences between when they initiate an interaction with a webpage and when they see a visual response
There’s more to a great site than your Core Web Vitals scores alone. But measuring and improving these metrics can help you provide a better overall experience for your users and even boost your SEO results.
How to Test Website Performance
Let’s go over two website performance tools and how to use them:
PageSpeed Insights
Google’s PageSpeed Insights (PSI) is a free, easy-to-use tool that measures a single webpage’s performance and provides a Core Web Vitals assessment along with recommendations for improvement.
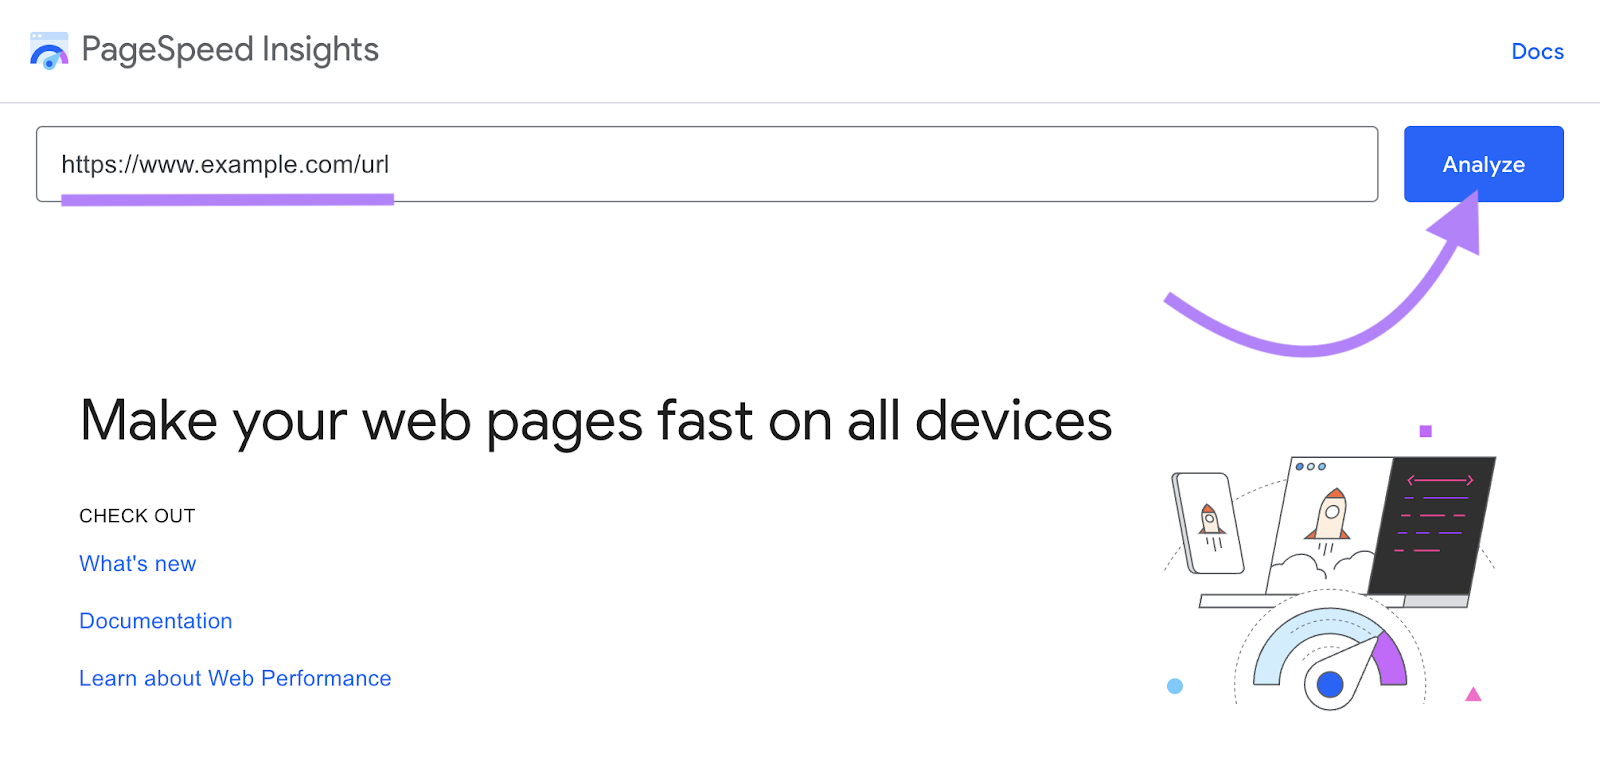
To start, open PageSpeed Insights and paste the URL you want to check into the search bar. Then, click “Analyze.”
The top of your report shows whether you passed the Core Web Vitals assessment.
Scroll down to the “Diagnose performance issues” section to see your performance score. Which is on a scale out of 100.
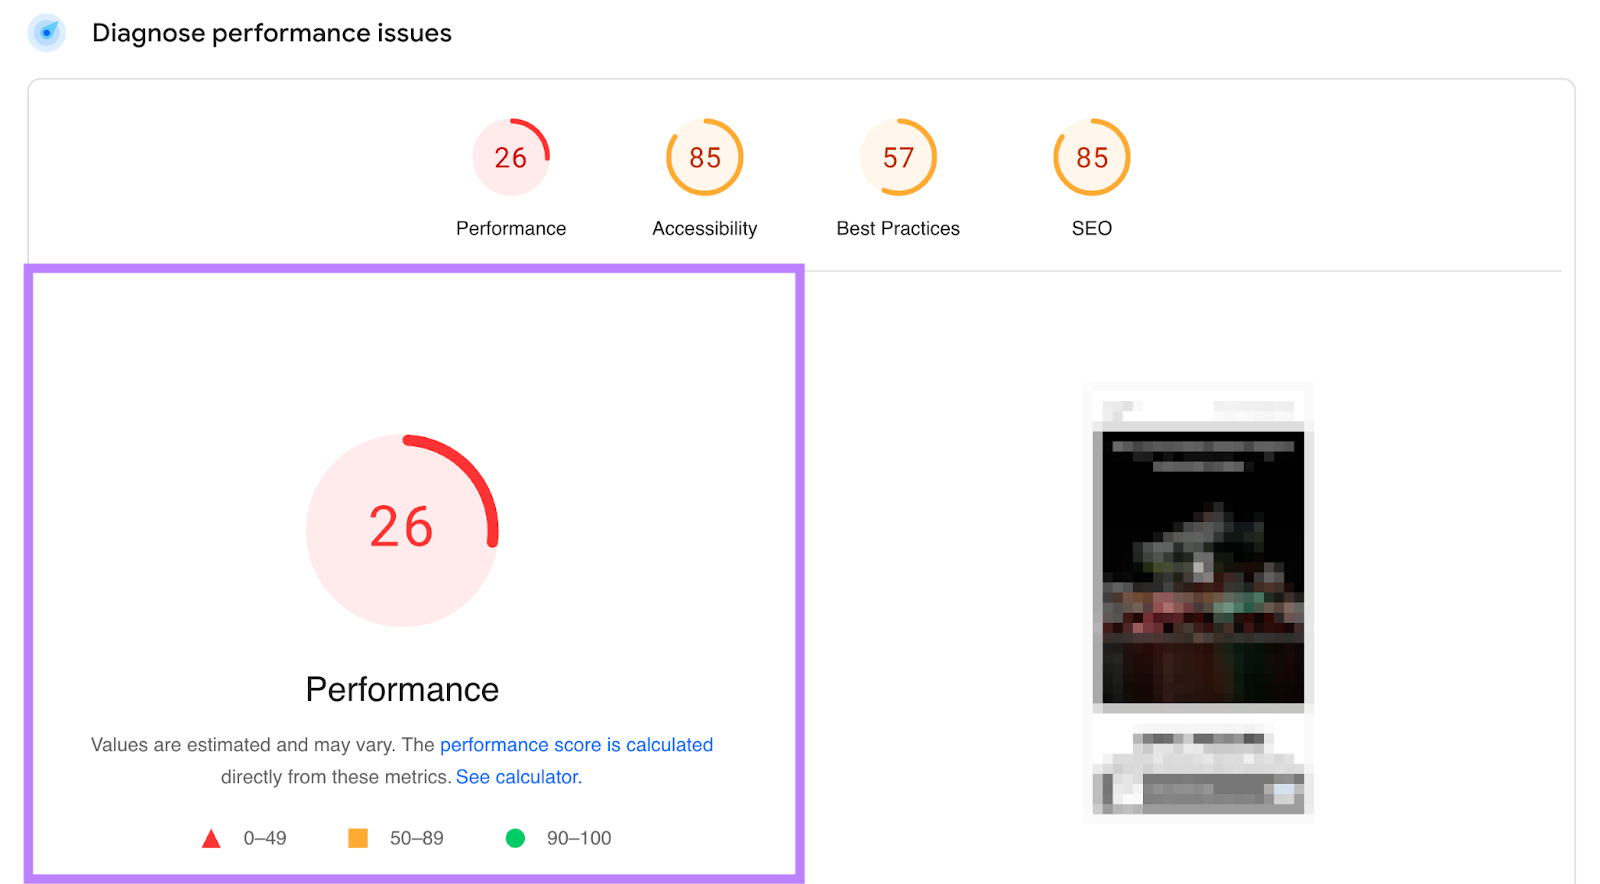
Google considers a score over 90 to be good. Any score between 50 to 89 needs improvement. And a score of between 0 and 49 is poor.
Scroll down further to the “Diagnostics” section for a list of ways to improve performance. Like properly sizing images, cleaning up your code, and reducing server response times.
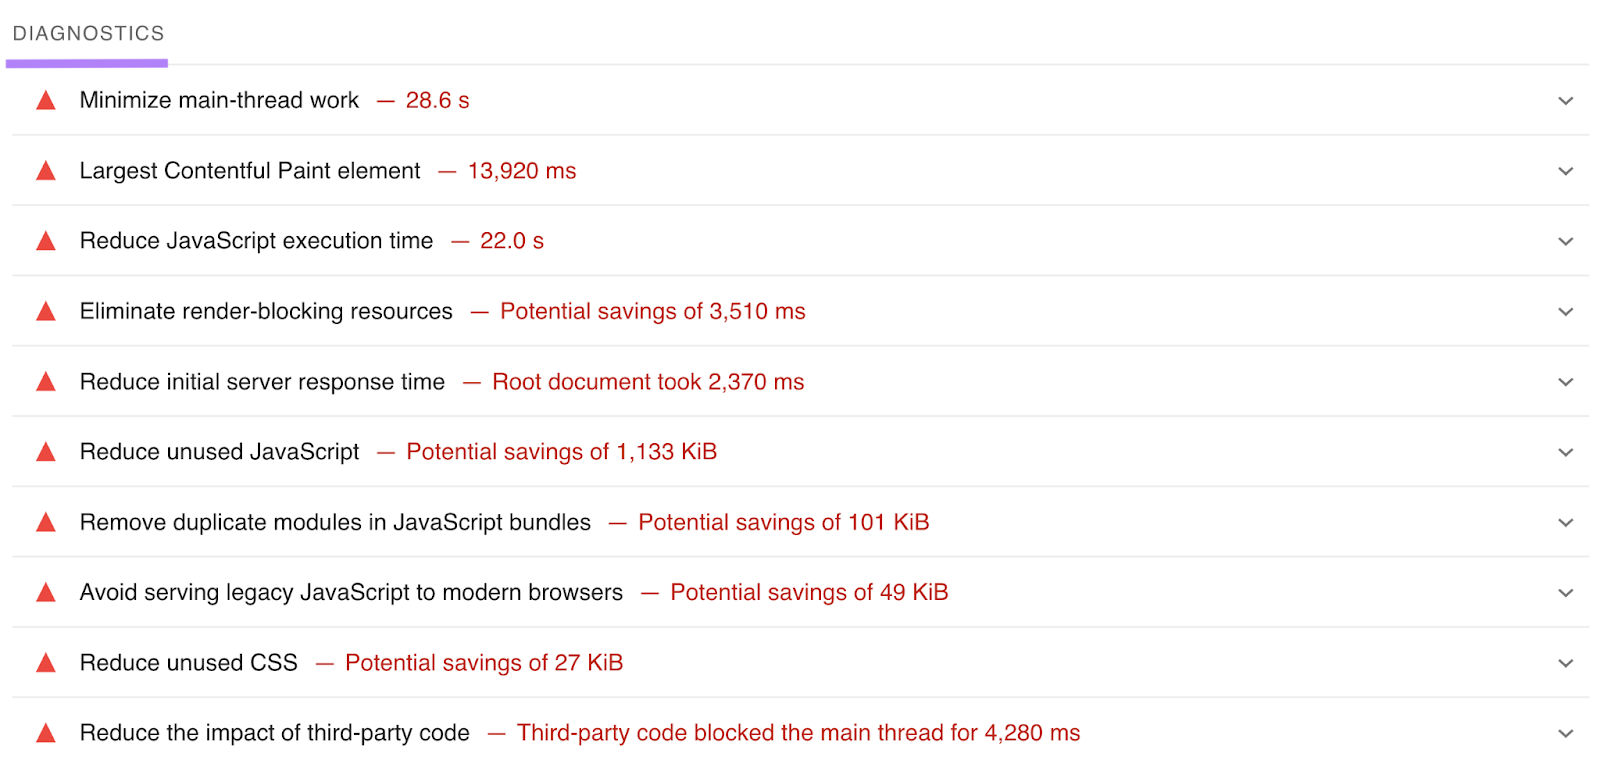
Some of these suggestions are rather technical. So, reach out to a developer if you need help.
Site Audit
Semrush’s Site Audit tool gauges your site’s performance, highlights issues, and offers improvement recommendations.
Open the tool, enter your domain in the search bar, and click “Start Audit.”

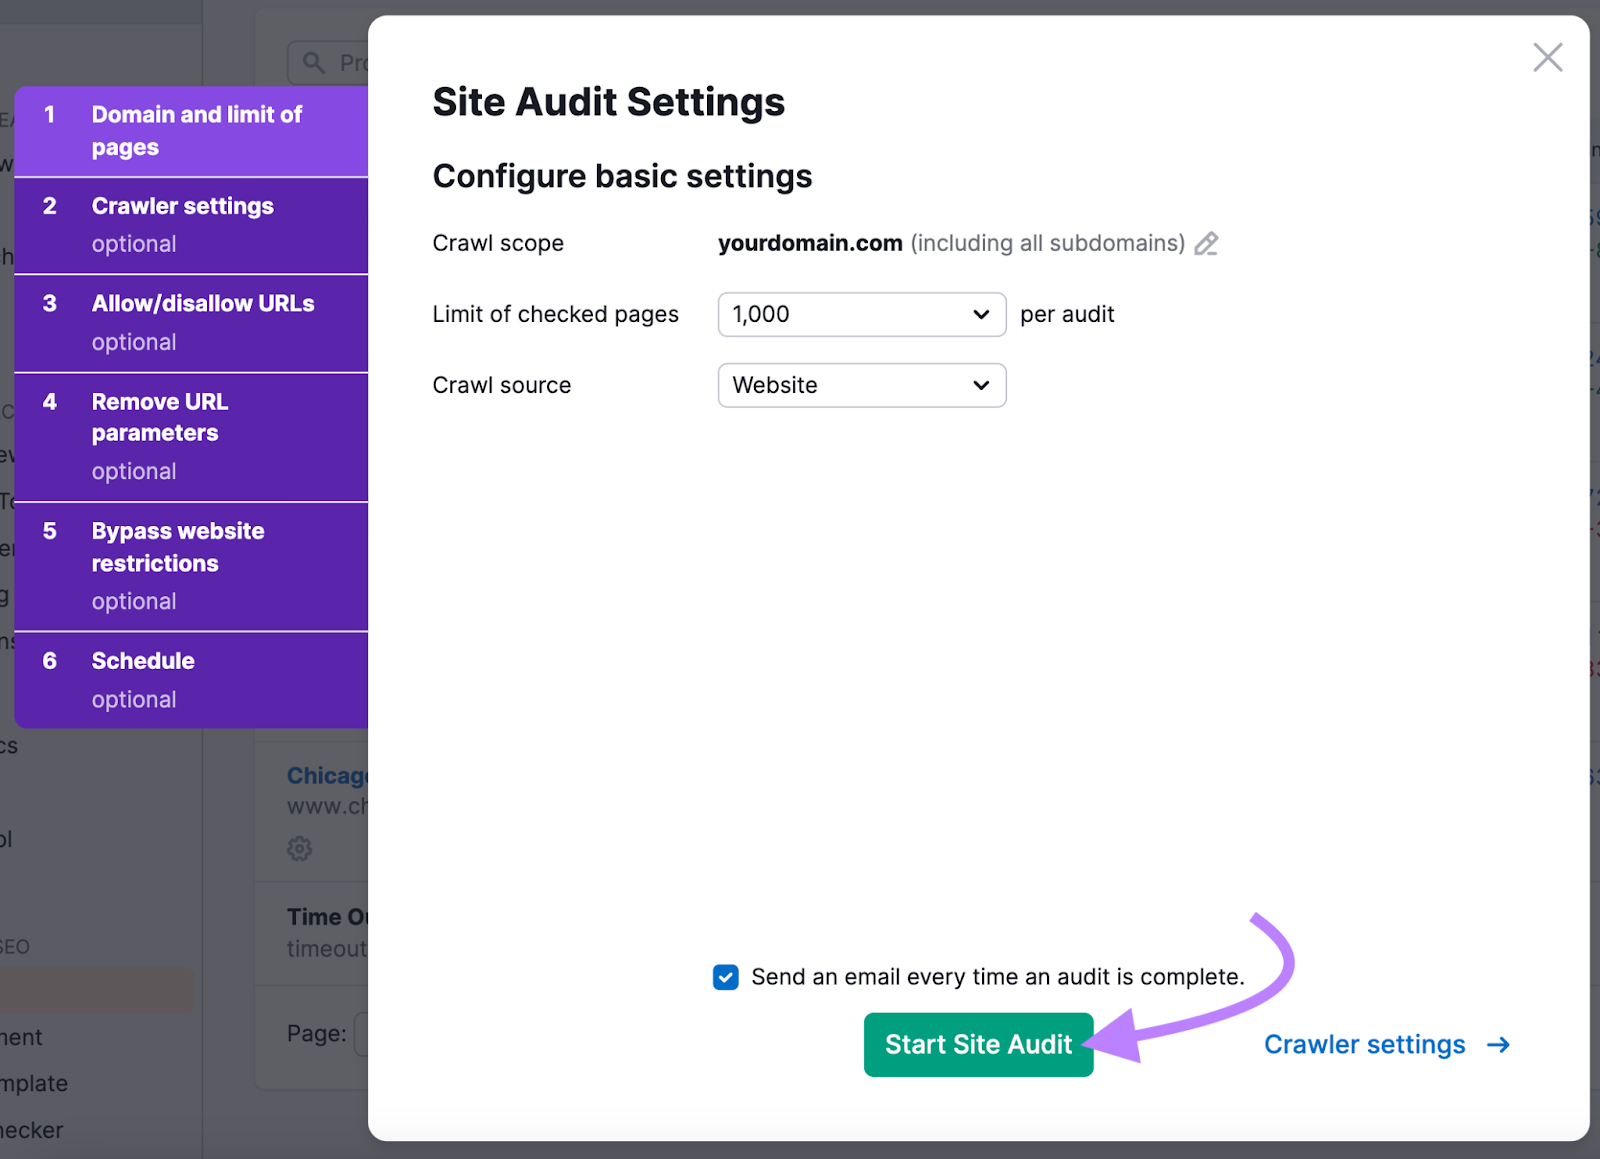
Next, configure your settings. If you're just getting started (or simply want to test out the tool), you can proceed with the pre-configured default settings.
Click “Start Site Audit” to start the audit.
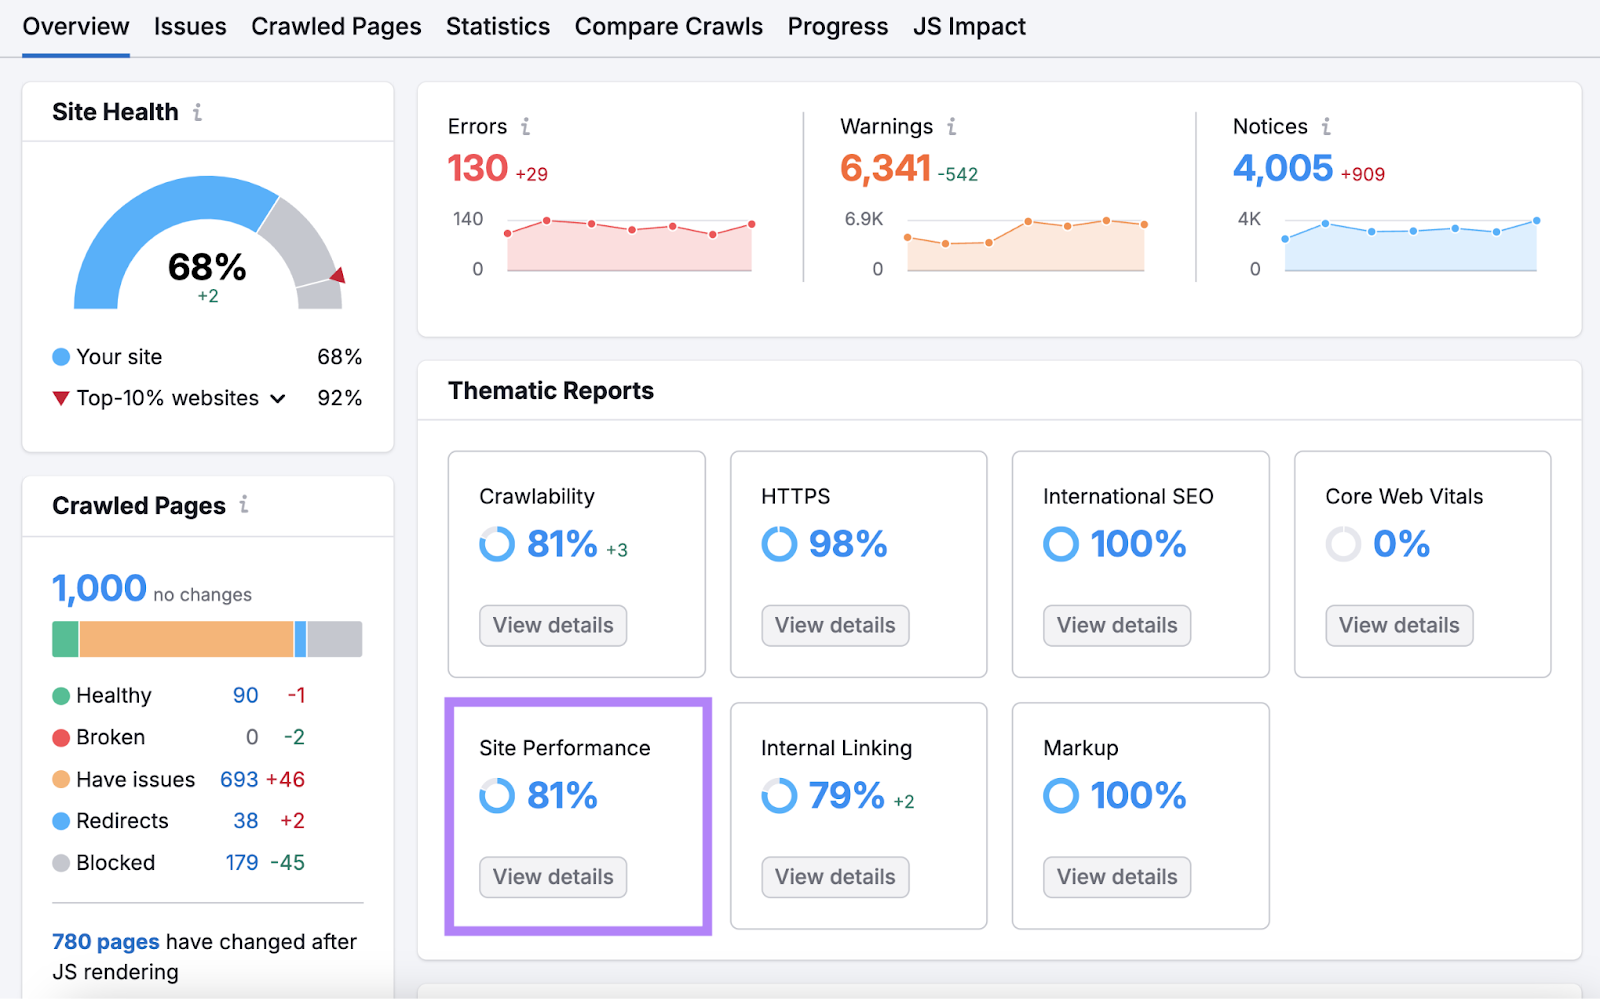
When your report is ready, you’ll see a dashboard.
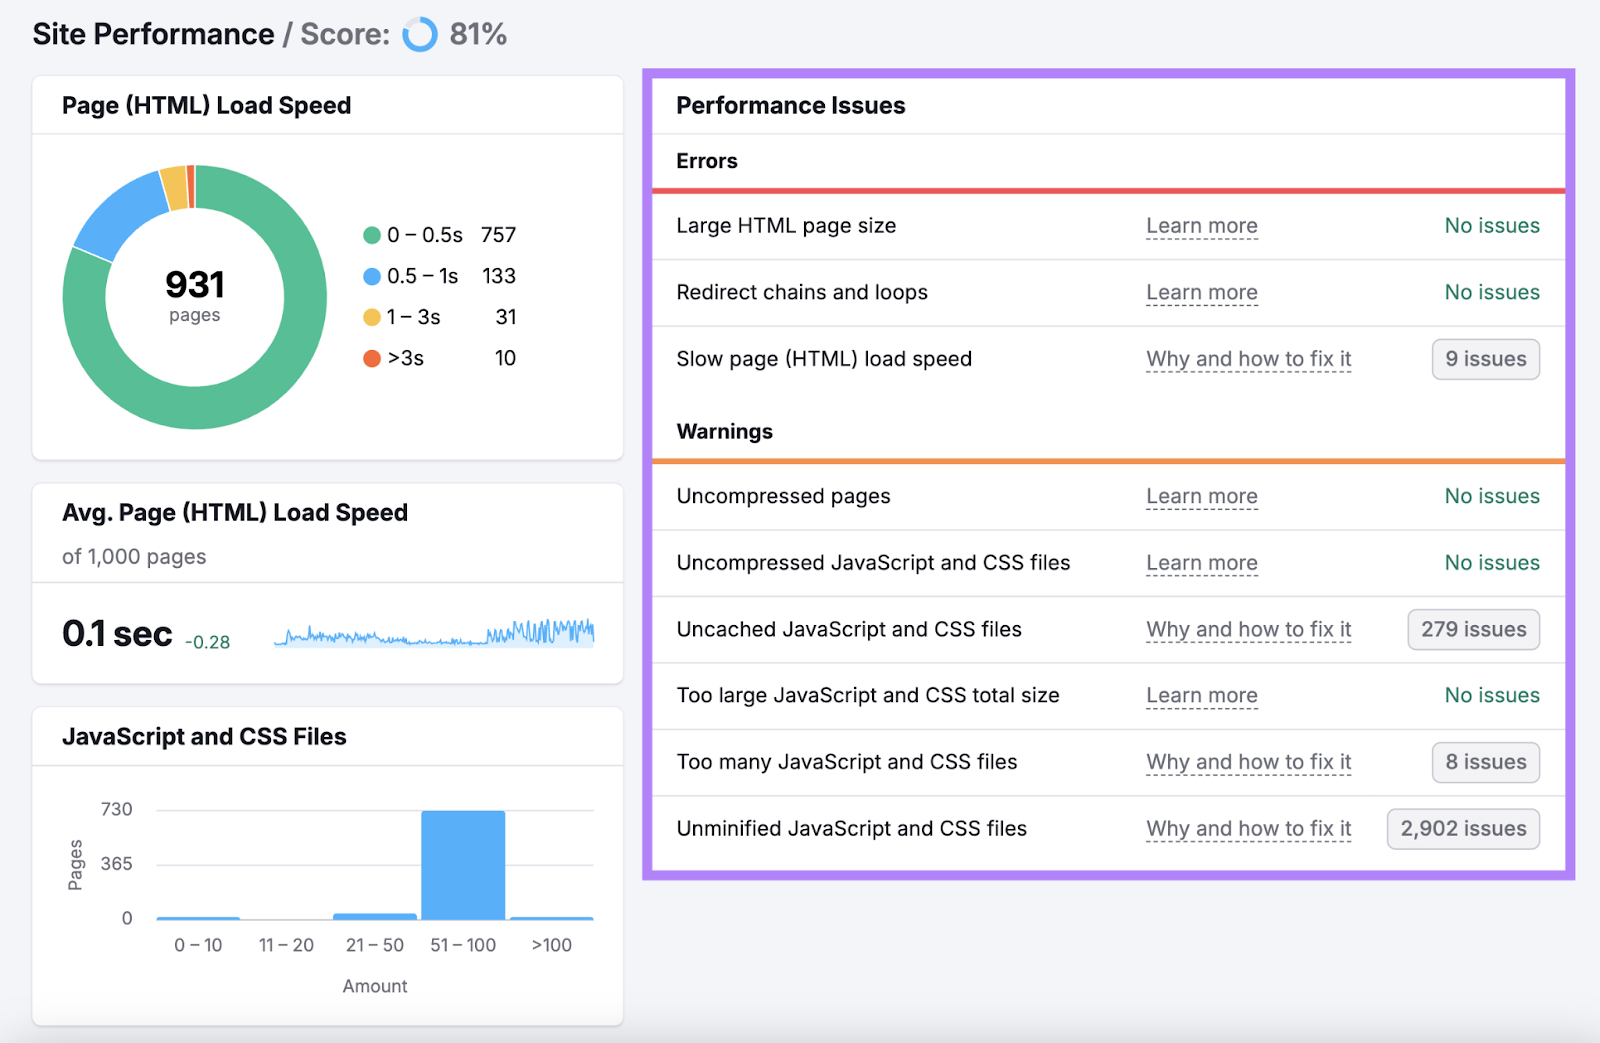
Click “View details” under “Site Performance.”
You’ll then see a report detailing your website’s performance. And any related issues it’s facing.
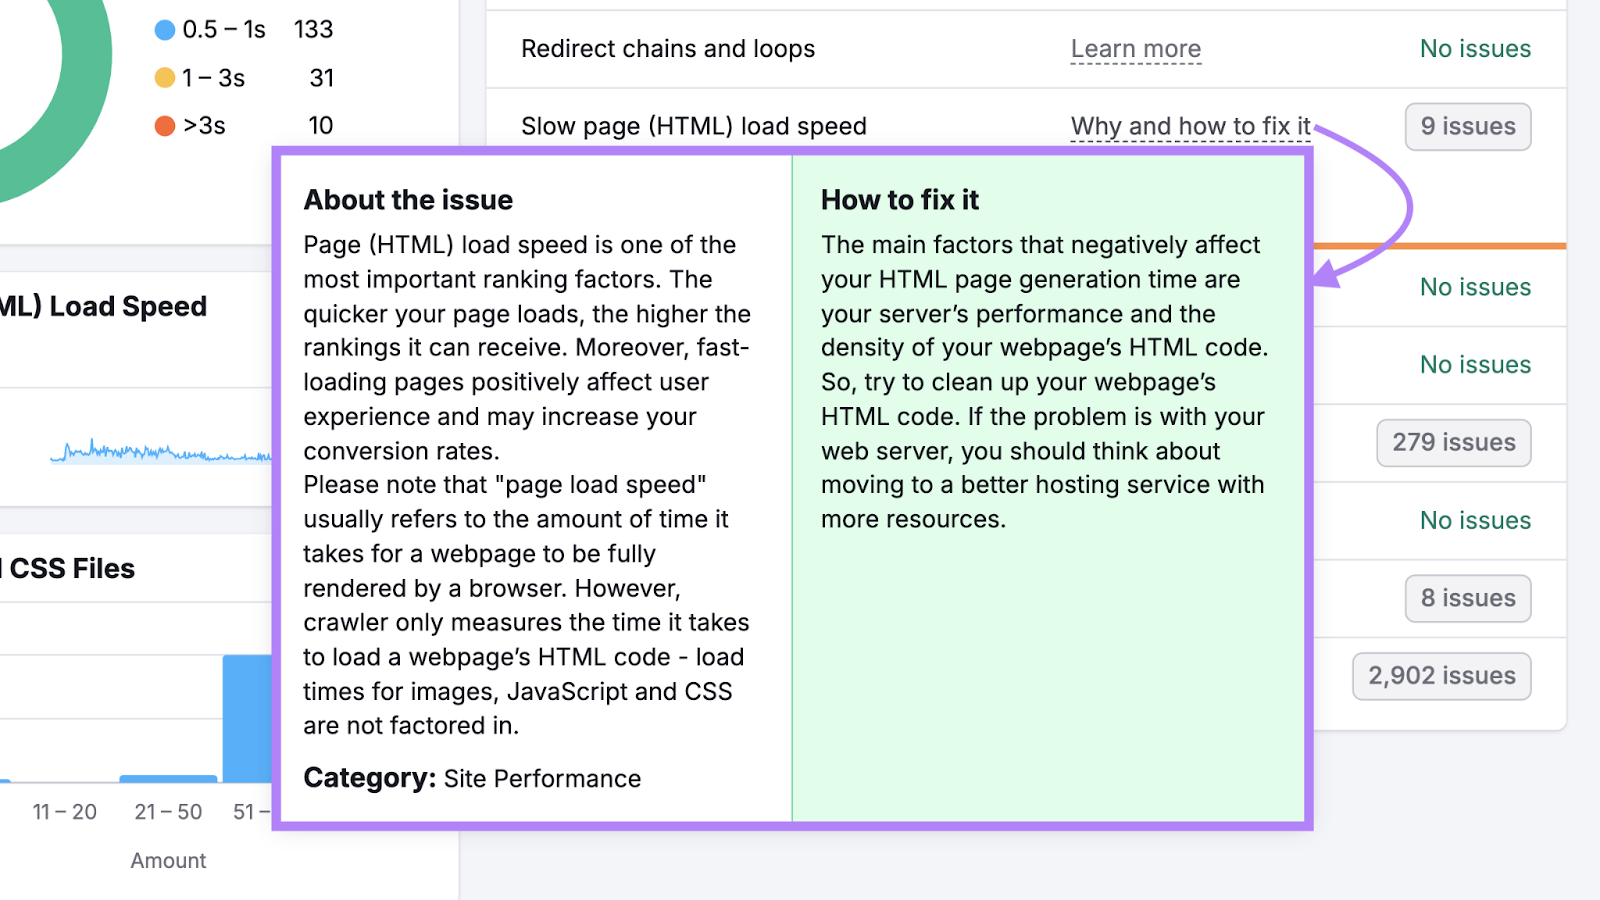
If you’re unsure of how to tackle a concern, click on “Why and how to fix it” next to the corresponding issue for more information. And you can consult with a developer for complex technical issues.
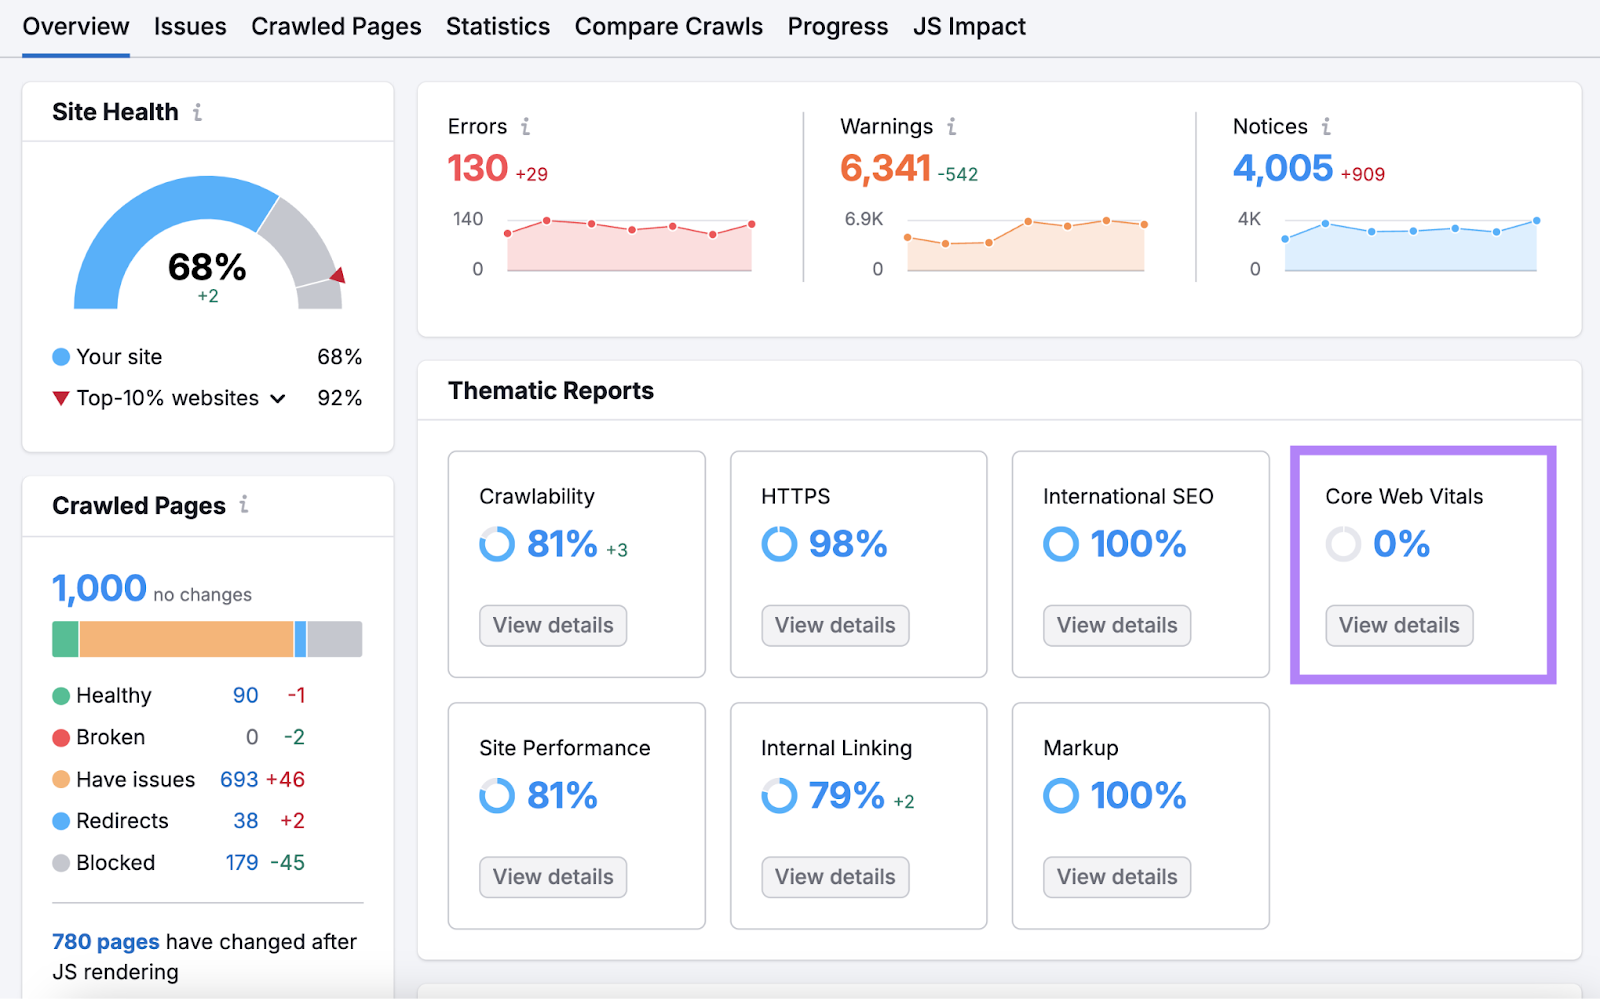
Next, check out your Core Web Vitals report to gauge your site’s interactivity.
From your main dashboard, click “View details” under “Core Web Vitals.”
You’ll see a breakdown of each metric, along with top improvements you (or your developer) can make. And note that Site Audit uses Total Blocking Time (TBT) as an approximation for INP.
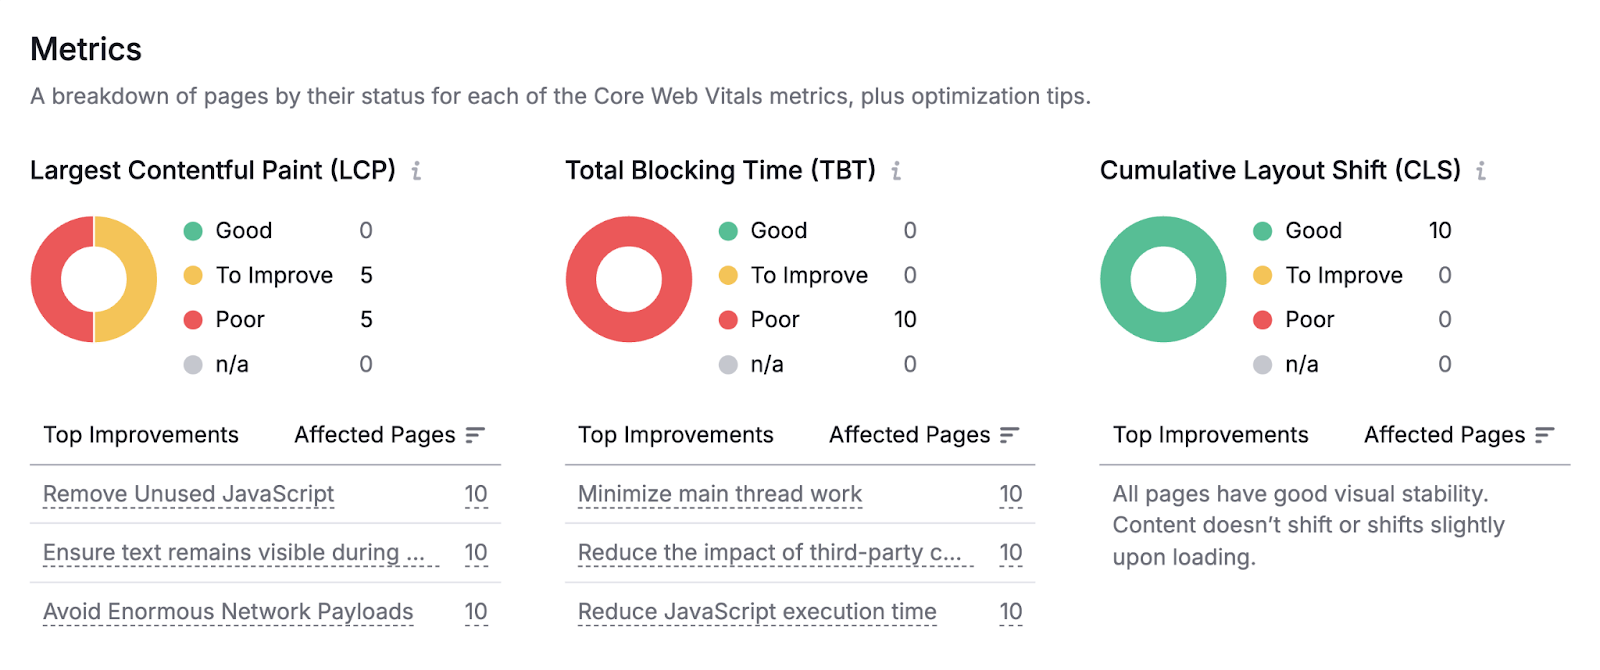
The tool checks up to 10 pages on your site. To focus the audit on your most important pages, scroll down to “Analyzed pages,” and click “Edit list” above the table.

9 Website Performance Optimization Best Practices
After testing your website and identifying factors affecting its performance, it's time to make improvements.
These nine performance optimization techniques can help with specific improvements based on what your test showed, but they're also valuable best practices for keeping your site performing well in general.
1. Optimize Images
Images with large file sizes can slow down page load times because the user's browser has to download more data.
To improve page speed, be selective about the images you’re using. And only include images that add real value for users.
Then, optimize your visuals by:
- Choosing the right image format: For photos and illustrations, use JPEG. For images that need transparent backgrounds (like logos or icons) use PNG. But opt for more modern image formats like WebP when possible because they offer smaller file sizes while maintaining quality.
- Compressing your images: Use compression tools like TinyPNG to reduce file size without significantly impacting image quality
- Specifying image dimensions: Specify the height and width for your images within <img>tags to help prevent layout shifts and improve UX. If you’re not sure how to do this, work with a developer or check your content management system (CMS) or website platform settings for optimization options.
- Serving responsive images: Responsive images (like the ones below) adjust to fit the user’s screen and minimize loading times. Most modern website platforms (like Wix) do this automatically, but you can also ask a developer for help.

2. Choose Your Fonts Carefully
If you’re not careful about your website’s font choices, it can slow down your load time, lead to layout shifts, and even harm readability.
For instance, web fonts need to be downloaded by the browser before they can be displayed. Which can slow down how quickly users see content on your page.
And simply choosing the wrong look can make your text difficult to read. For example, if you choose an ornate font that doesn’t display well on mobile.
To ensure fonts enhance (or at least don’t disrupt) your site’s performance:
- Avoid using web fonts when possible: While web fonts can give your site a unique look, they can slow down your site. If you do use them, reserve them for headings or special elements to minimize their impact on load times.
- Use system fonts for body text: System fonts like Arial or Helvetica are already installed on users' devices, so they load instantly
Your developer can also help speed things up by using WOFF2, a newer font format that loads faster.
They can also set rules for how browsers handle fonts. Which can make your site feel quicker and keep text from shifting as it loads.
3. Minimize Unnecessary Redirects
Redirects automatically send users and search engines from one URL to another—like when you delete pages and move content. But too many can slow down your site.
You can use Semrush’s Site Audit tool to check if your site has issues with redirects.
Open your report and navigate to the “Issues” tab. Type “redirect” into the search bar and you’ll see a list of redirect-related issues. Like this:
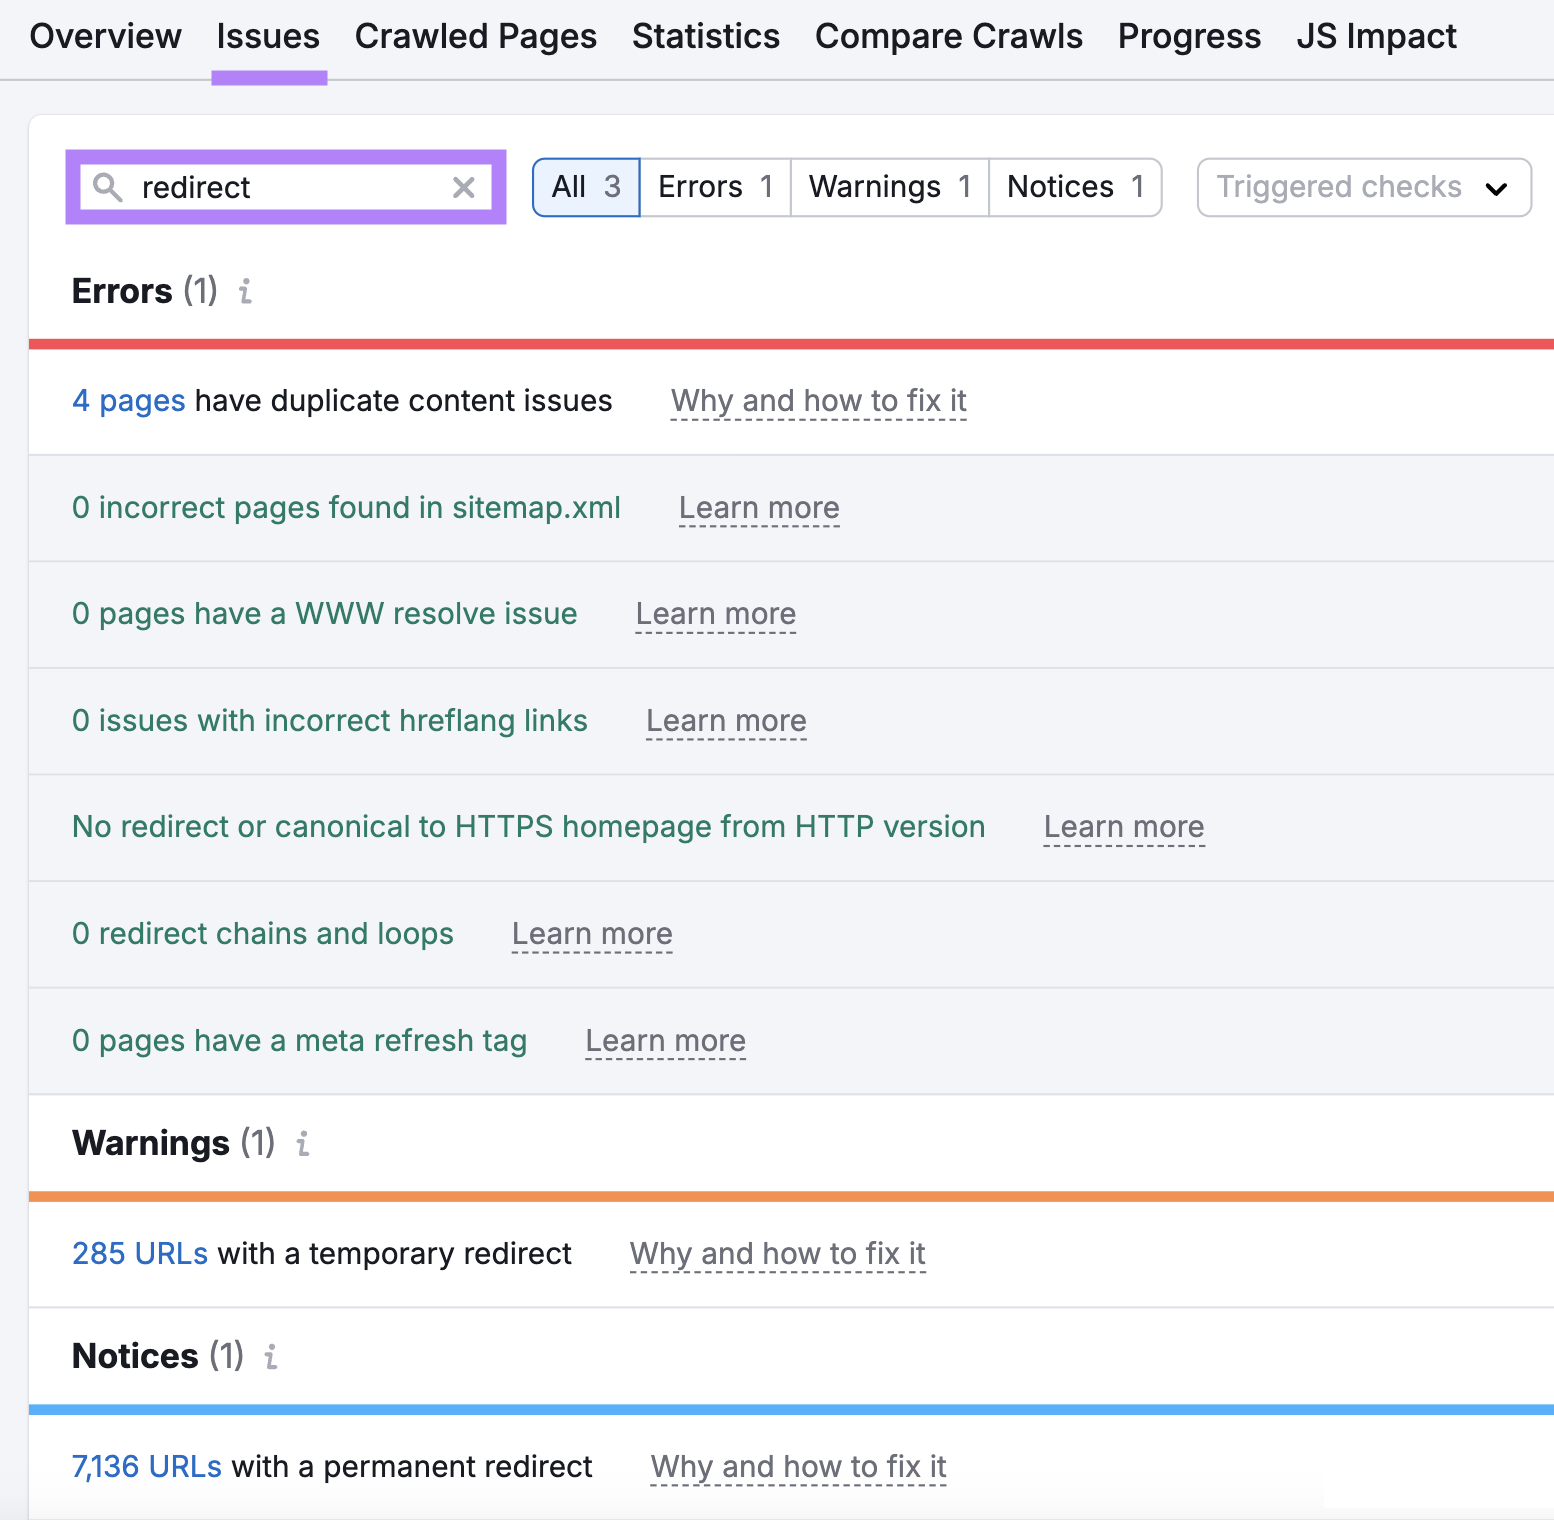
First, check under “Errors” for any problems with redirect chains and loops.
Redirect chains happen when there are multiple redirects between the initial URL and the final destination. Like this:
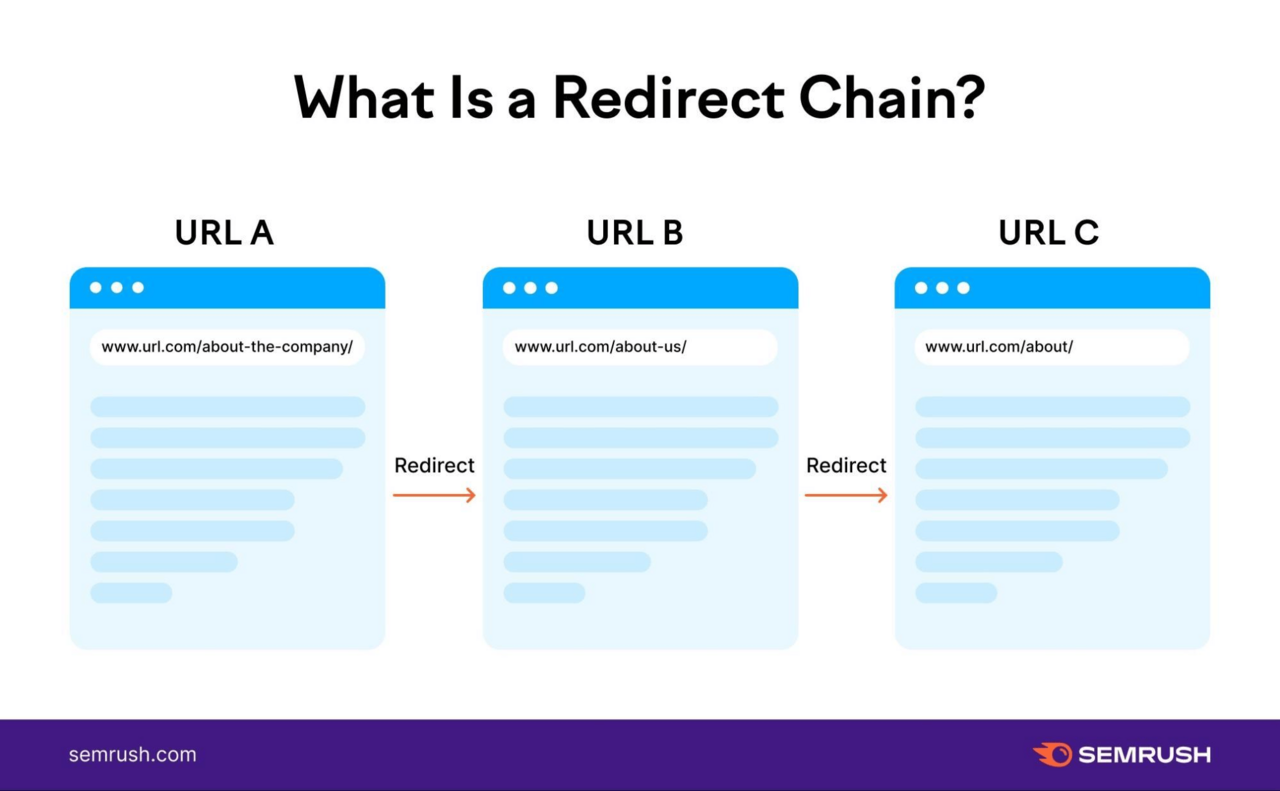
To fix a redirect chain, redirect straight from the old URL to the final destination URL
Redirect loops occur when two or more pages redirect such that search engines and users never reach a final destination. Like this:
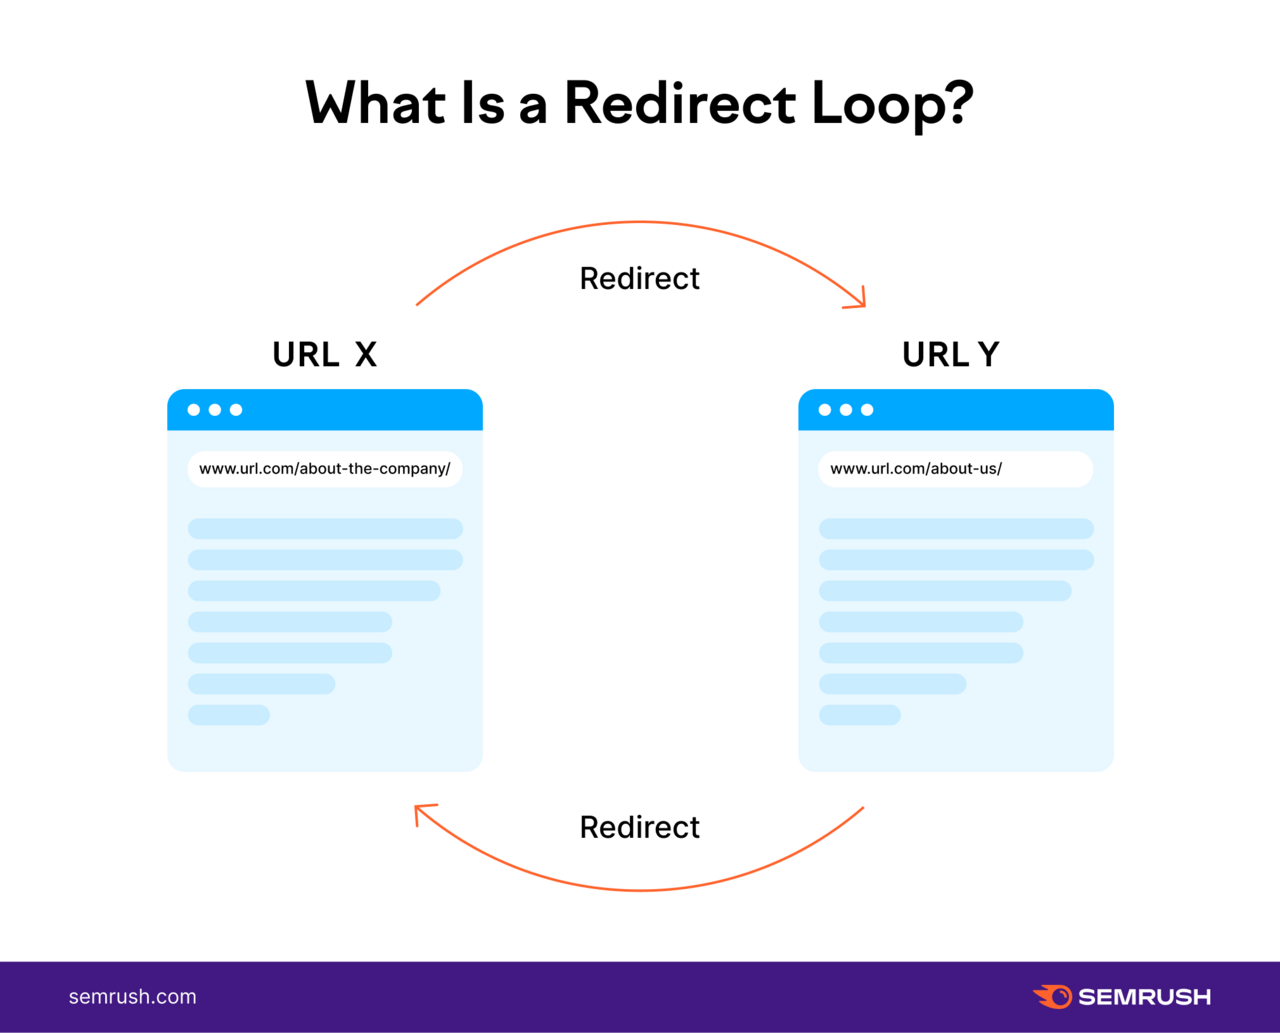
Fix redirect loops by identifying the final, correct destination and ensuring each page redirects to it.
Next, look under “Warnings” for any temporary redirects. Click on “# URLs” to view the full list and remove any you no longer need.
Finally, check out “Notices” for permanent redirects. These send users to a new URL indefinitely.
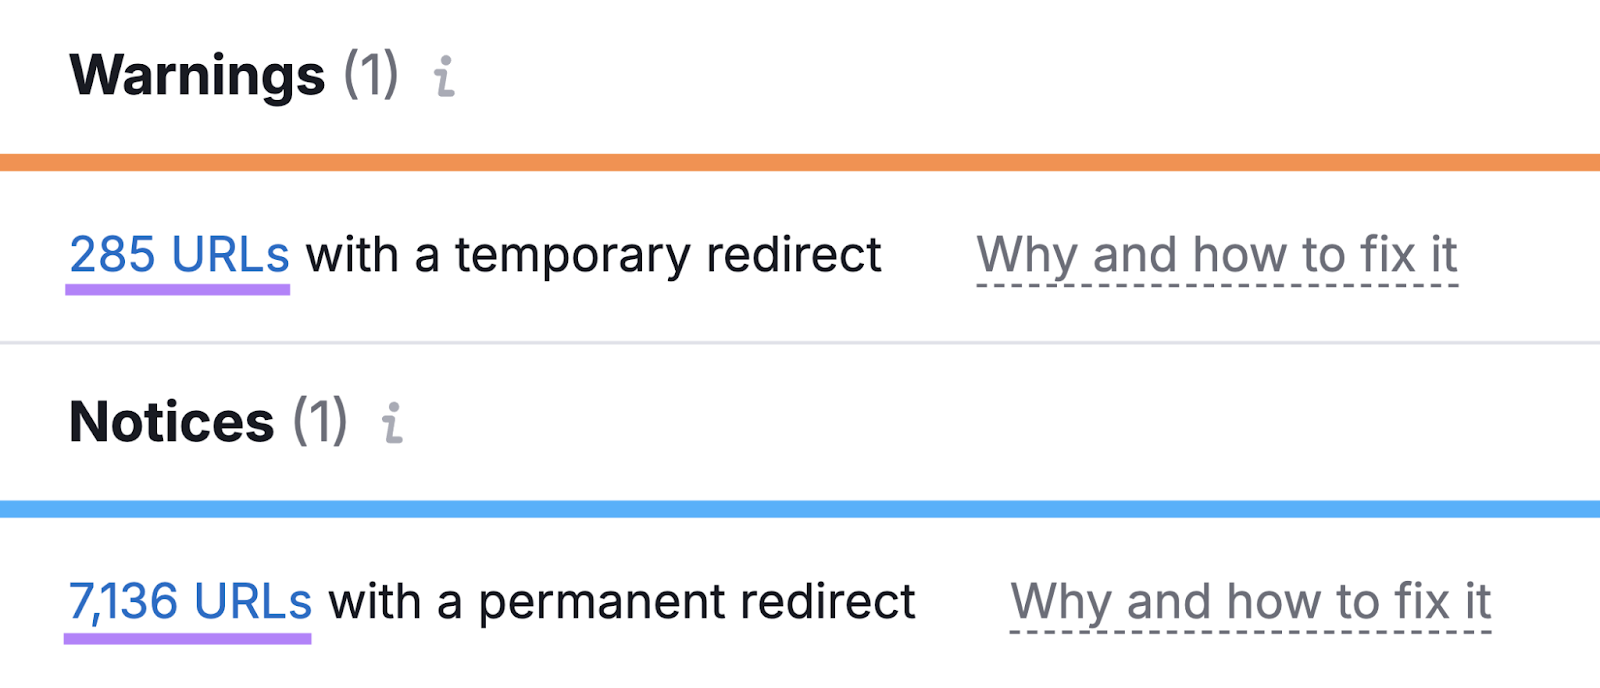
Go through the full list and remove any unnecessary ones. Like if the original page is no longer accessed or needed.
4. Reduce the Number of HTTP Requests
An HTTP request is when a browser asks for information from a server like when it needs to load a file.
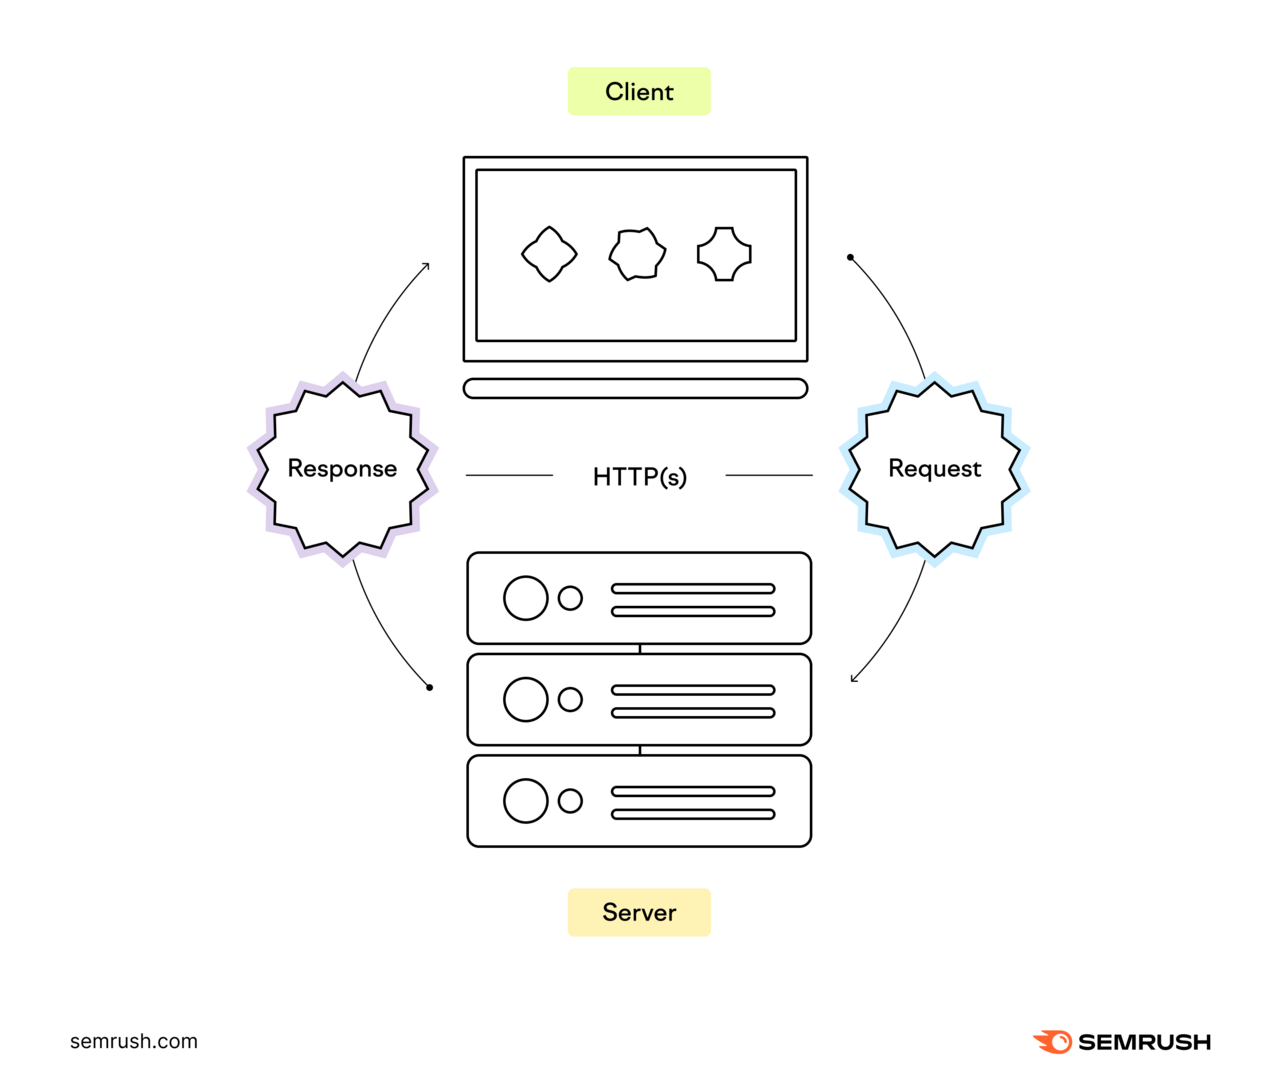
More requests generally mean slower page load times. Because each request requires a round trip between the user’s browser and the server.
You can see the number of HTTP requests for a page using your browser’s developer tools.
On Chrome, open the page you want to assess. Right-click on the screen and select “Inspect.”

Navigate to the “Network” tab. Then, reload your page to collect data.
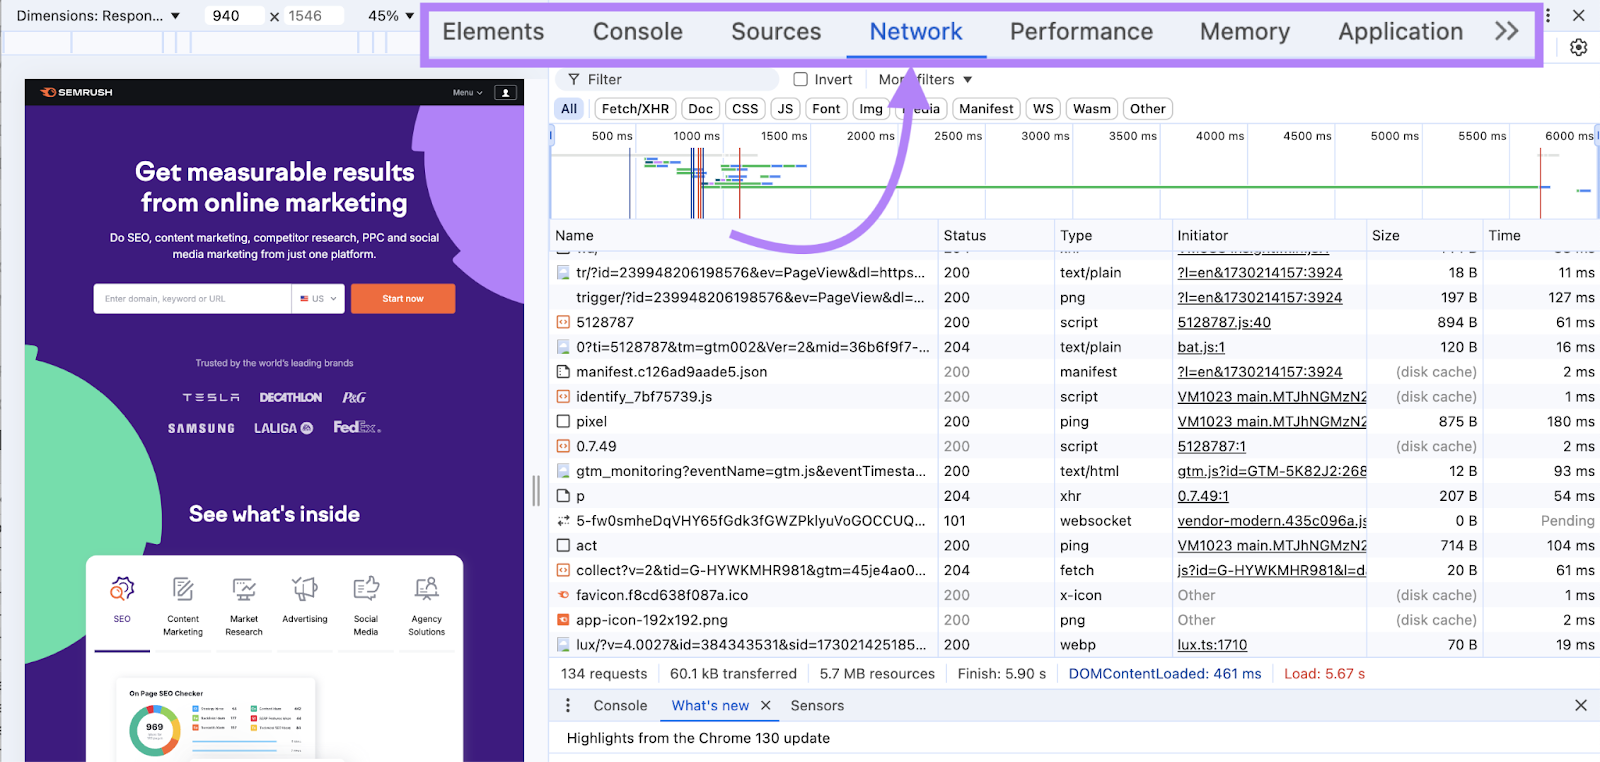
You’ll see all the requests and information about each. And the total number of HTTP requests in the bottom left corner of the window.
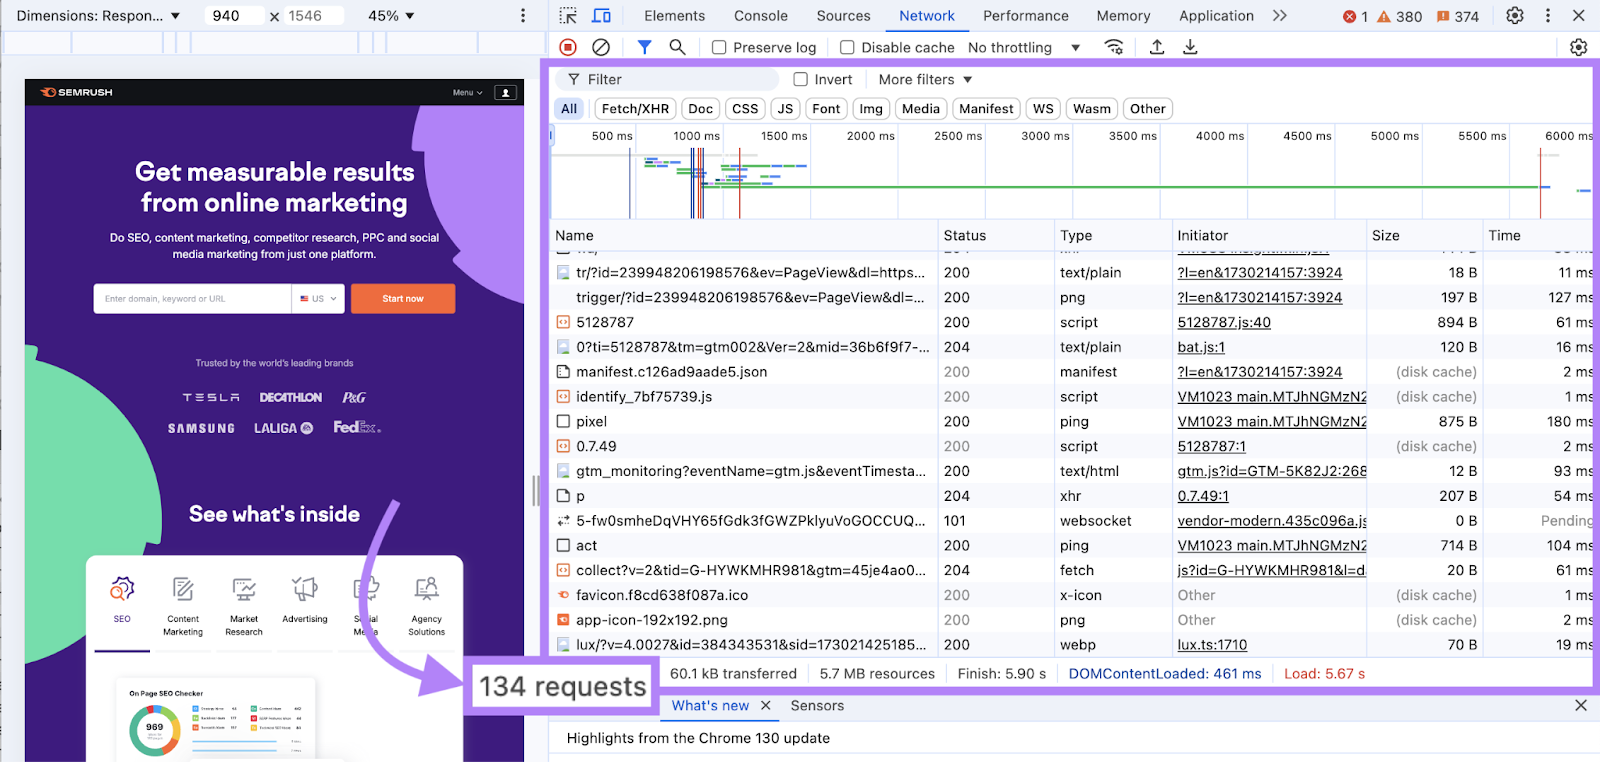
There are some beginner-friendly ways to reduce the number of HTTP requests on a page. Like removing unnecessary elements (e.g., buttons that can be eliminated) and using fewer plugins.
But the safest way is to consult with a developer. They can help you implement more advanced techniques to reduce HTTP requests without risking your site's functionality or user experience.
5. Minify CSS and JavaScript Files
Minifying means making your code files smaller without changing how they work. And that speeds up your site.
Developers can minify code by:
- Removing unnecessary characters like extra spaces and line breaks
- Deleting code comments and formatting
- Getting rid of unused code
- Using shorter names for variables and functions
For example, unminified CSS might look like this:
/* Main styling for the header */
.header {
background-color: #2c3e50;
color: #ecf0f1;
padding: 20px;
margin-bottom: 30px;
}
/* Navigation menu styles */
.nav-menu {
display: flex;
justify-content: space-between;
list-style-type: none;
}
.nav-item {
margin-right: 15px;
font-size: 18px;
}
/* Hover effect for nav items */
.nav-item:hover {
text-decoration: underline;
color: #3498db;
}
The same CSS, when minified, looks like this:
.header{background-color:#2c3e50;color:#ecf0f1;padding:20px;margin-bottom:30px}.nav-menu{display:flex;justify-content:space-between;list-style-type:none}.nav-item{margin-right:15px;font-size:18px}.nav-item:hover{text-decoration:underline;color:#3498db}You can use Site Audit to check if your site has unminified code.
Open the project you want to assess and click “View details” under “Site Performance.”

Scroll down to the “Warnings” section.
If there’s an opportunity to minify your code, you’ll see an “# issues” button on the “Unminified JavaScript and CSS files” line.
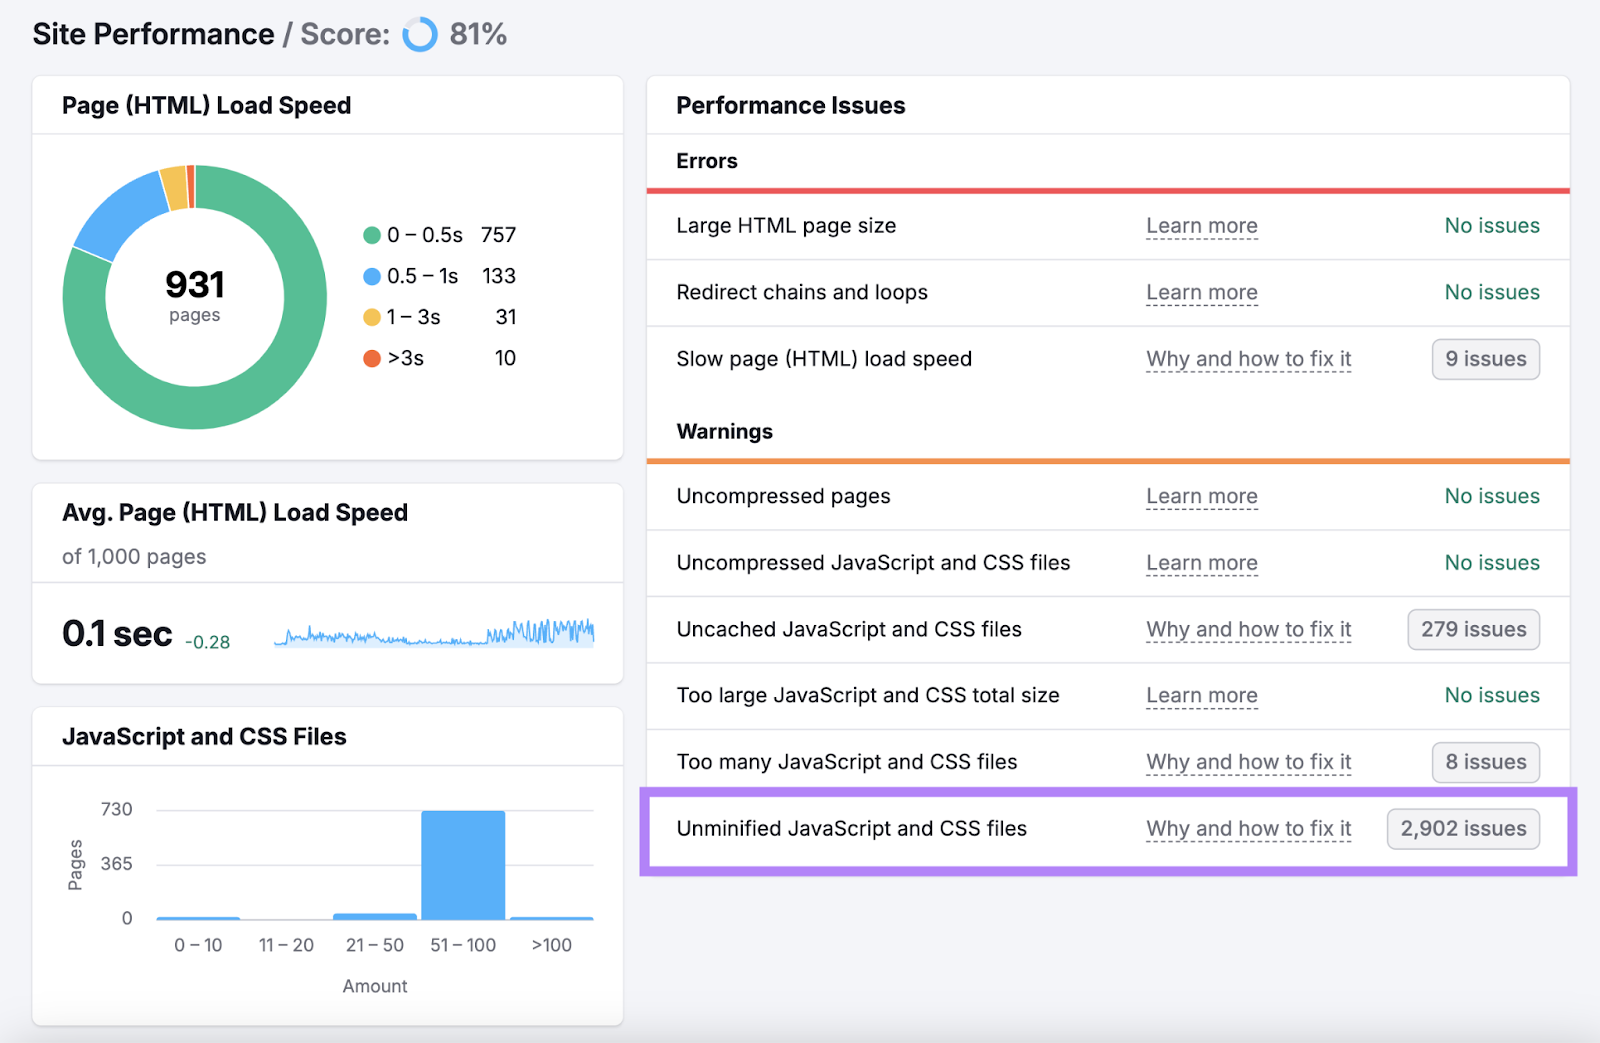
Click on the “# issues” button for a full list of affected pages. Then, pass this information along to your developer.
If you have a WordPress site, you can use plugins like WP-Optimize. Just be mindful that plugins themselves can slow down your site—we’ll cover this more later on.
6. Use a Content Delivery Network
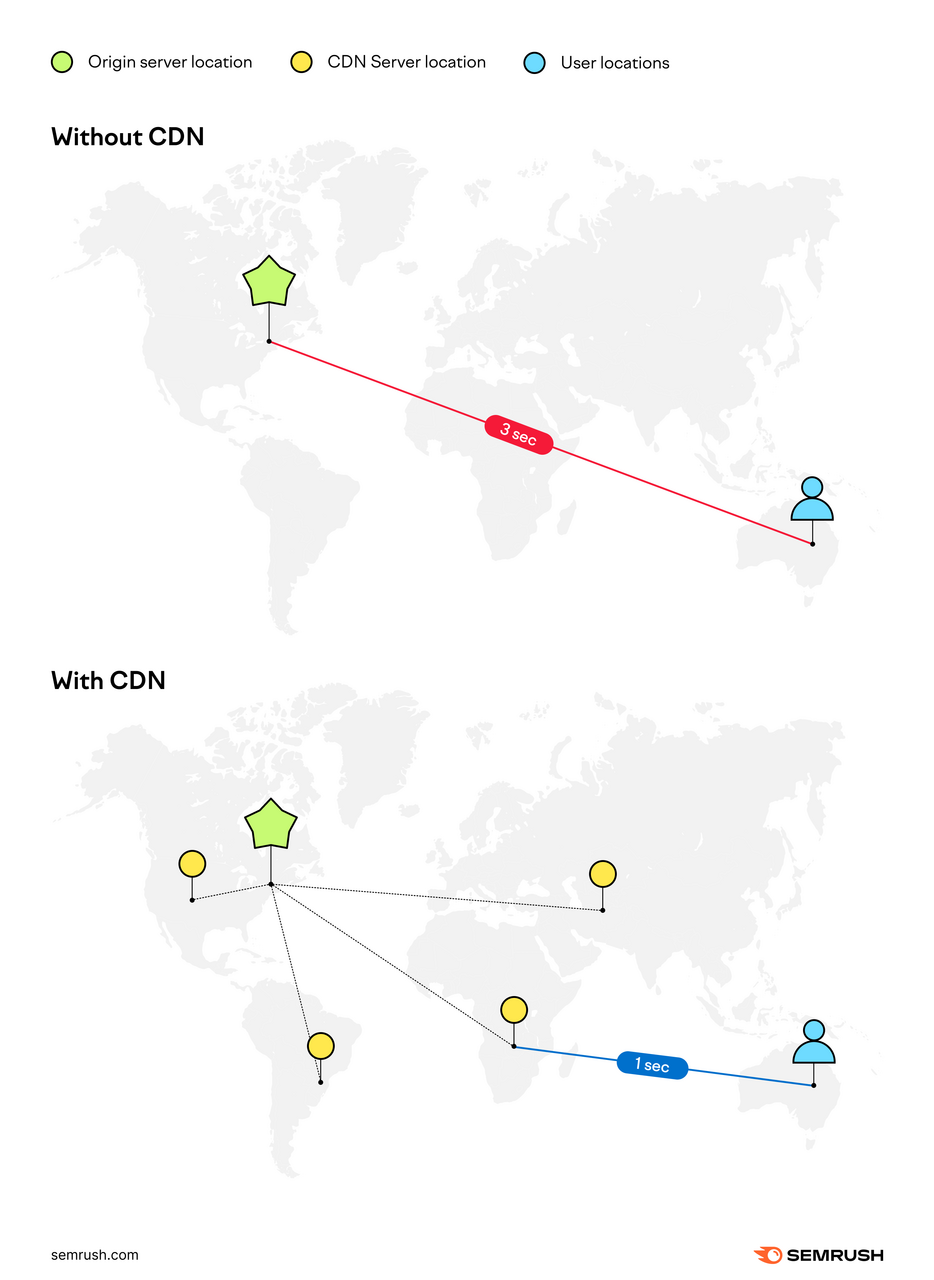
A content delivery network (CDN) is a group of servers spread around the world that deliver content to the users nearest them to speed up your site.
Let's say your website's main server is in New York but you use a CDN. In that case, someone in Australia visiting your site can receive content from a closer server rather than the one in New York.
Here’s a simple, visual representation:
How can you use a CDN?
First, choose a trusted provider.
For example, Cloudflare, Amazon CloudFront, Fastly, or Microsoft Azure Content Delivery Network.
But the best CDN for you will depend on factors like your budget, where your users are located, and your security requirements.
7. Choose Good Web Hosting
The quality of your web hosting affects how quickly your site loads and its ability to handle traffic spikes.
There are several types of hosting, each with different performance implications.
For example:
- Shared hosting: This option is often the most affordable. Though it can lead to slower performance, especially during high-traffic periods, because you’re competing with other sites on the server for resources. But it’s a good option for small blogs and personal sites.
- Virtual private servers (VPS): This is a step up from shared hosting. Your site still shares a physical server with other websites but gets a guaranteed amount of resources.
- Dedicated hosting: Your website gets its own server. This provides maximum control and performance, but it can be expensive. It's suitable for high-traffic websites and those with specific server configuration needs.
- Cloud hosting: Multiple servers work together to host a group of websites. This offers scalable and reliable performance. And it can handle traffic spikes well.
If you're experiencing slow load times or frequent downtime (moments when your site is unavailable), consider upgrading your hosting plan or choosing a different type of hosting that offers more resources and better performance.
Some examples of hosting providers include Hostinger, SiteGround, Bluehost, WP Engine, and DigitalOcean.
8. Limit Third-Party Scripts
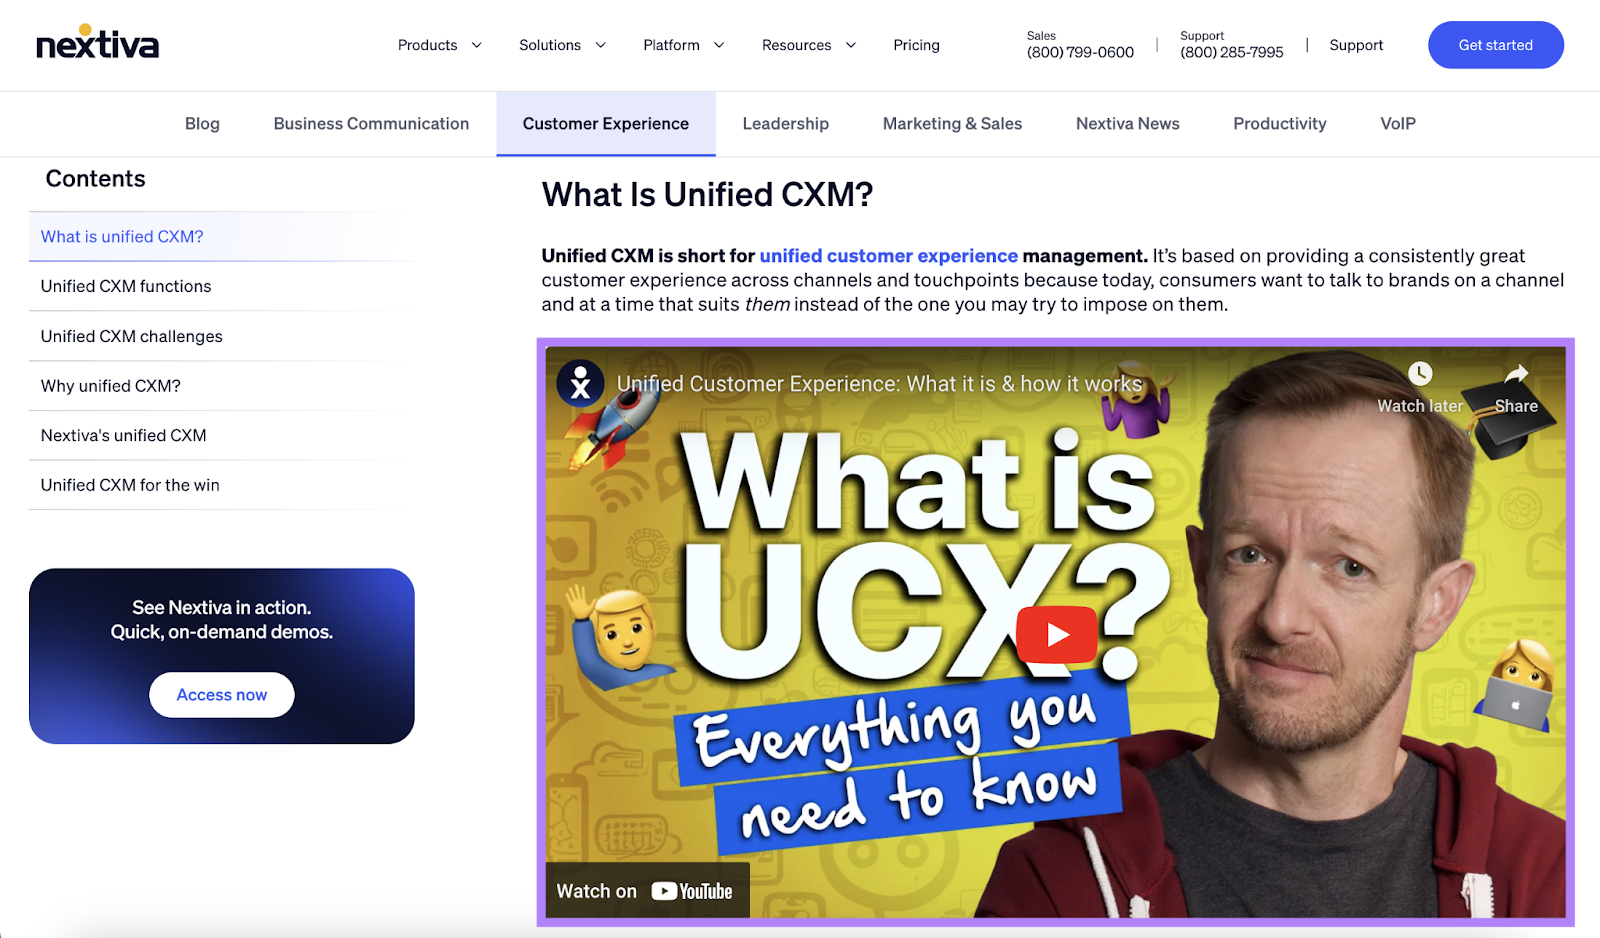
Third-party scripts are pieces of code from external services that add functionality and interactivity to your site. But they can also slow down your site for a number of reasons.
Here’s an example of a video embed enabled by third-party script:
Use Google’s PSI tool to check a single page for third-party script issues.
If there are any problems, you’ll see a “Reduce the impact of third-party code” error under “Diagnostics.”
Click on the error for a list of scripts impacting your page’s performance.
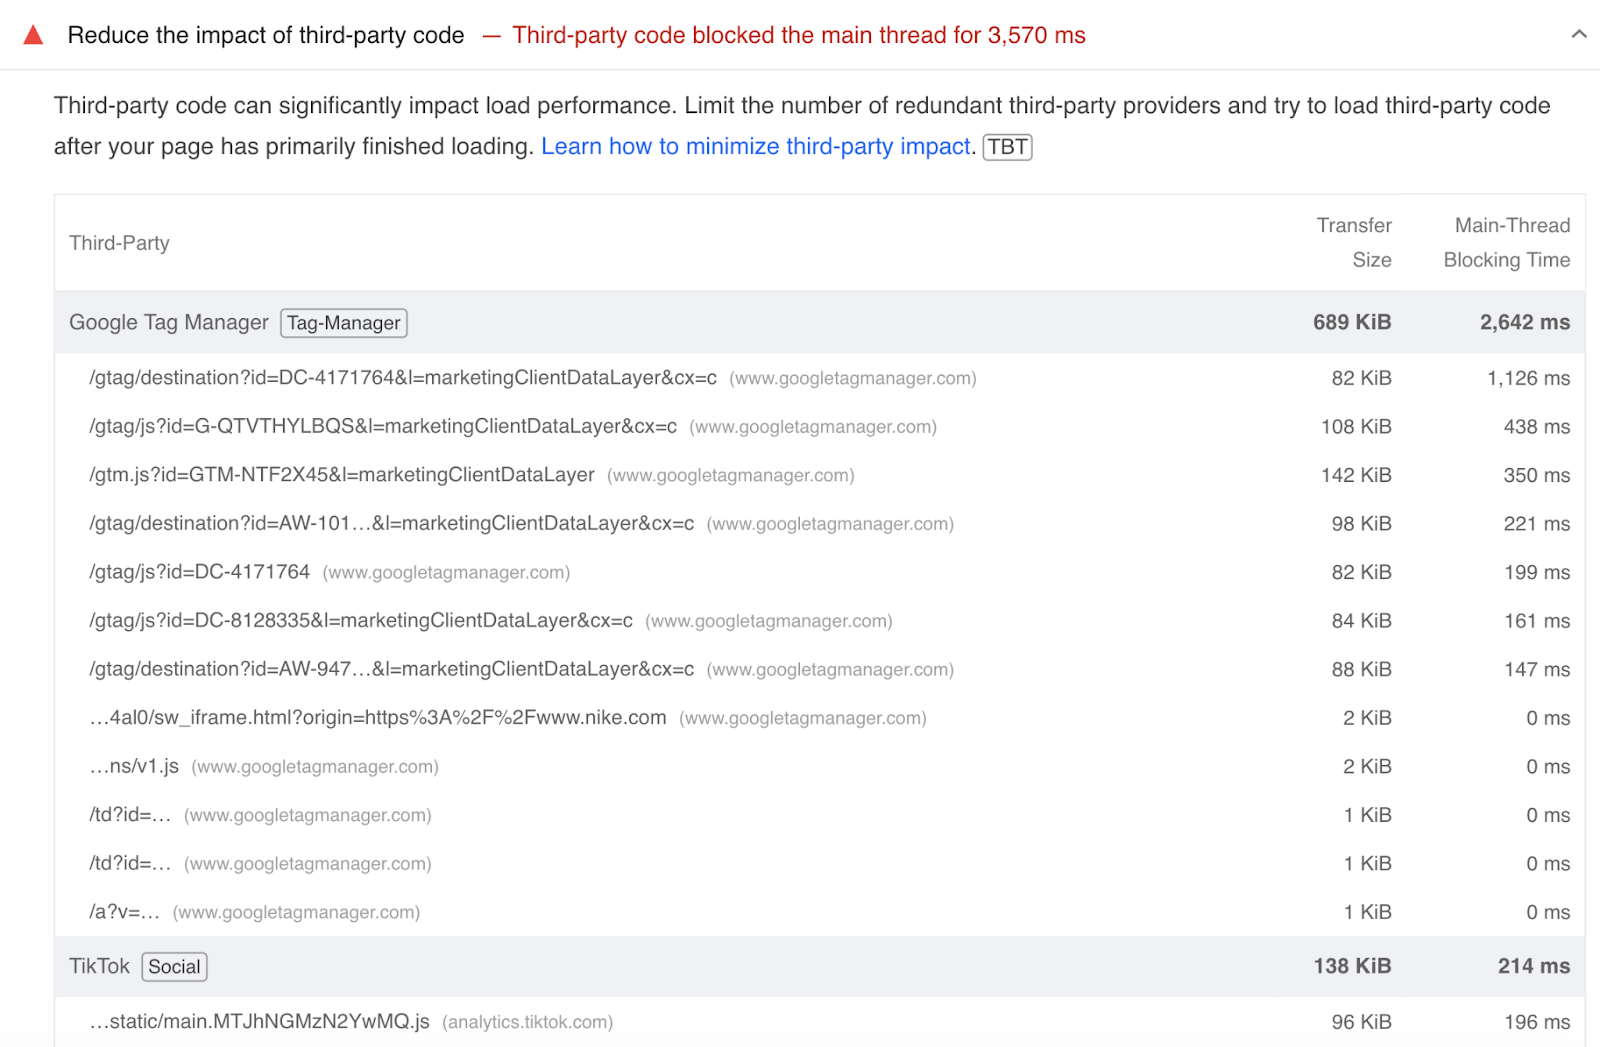
The simplest way to improve performance is to remove scripts you no longer use.
For example, if you added an Instagram sharing plugin to your blog posts but no longer promote your content that way, you can remove that script.
But often, third-party scripts are necessary for your site's functionality. So, speak to a developer to discuss options.
9. Enable Browser Caching
Browser caching is when a visitor's browser stores files after their first visit, so those files can be loaded more quickly when they return.
This improves the experience for returning visitors. But know that the initial visit won’t be any faster.
If you have a WordPress site, you can enable caching using plugins like LightSpeed Cache, W3 Total Cache, and WP Super Cache.
But because too many plugins can slow down your site, we recommend that you work with a developer to edit your server files to enable caching.
Maintain Strong Site Performance
Improving your site performance can improve your visibility in search results, incentivize users to stay longer, and even drive conversions.
But sustaining solid website performance requires ongoing attention and maintenance.
Use Semrush’s Site Audit tool to keep an eye on your site performance over time, catch potential issues before they become bigger problems, and identify opportunities to improve.
