Log file analysis is an essential component of any technical and on-site SEO audits. Log files are the only data that are 100% accurate when it comes to really understanding how bots are crawling your website. With log analysis, you can go further than a simple crawl and rank higher, get more traffic, conversions and sales.
A log file is a actually a file output made from a web server containing ‘hits’ or record of all requests that the server has received. Data are stored and deliver details about the time and date in which the request was made, the URL requested, the user agent, the request ID address and other ones.
Let’s see the advantages of log file analysis and how to do it for free.
Advantages of Log File Analysis
Log file analysis help you understand how search engines are crawling a website and its impact on SEO. These insights are a great help to improve your crawlability and SEO performance. With those data, you can analyze crawl behavior and determine some interesting metrics like:
- Is your crawl budget spent efficiently?
- What accessibility errors were met during the crawl?
- Where are the areas of crawl deficiency?
- Which are my most active pages?
- Which pages does Google not know about?
These are just a few examples of log files analysis opportunities. Google does have a crawl budget. Setting up the right improvements will help you save this budget and help Google crawls the right pages and come more often.
Here are a few metrics you should pay attention to:
Number of SEO visits
Log analysis helps determine the number of SEO visits (from organic results) received on a website. These are the pages that generate traffic. Are these pages the right ones? Are your most valuable pages driving organic traffic to your website? This is a pretty actionable metric.
Crawl frequency
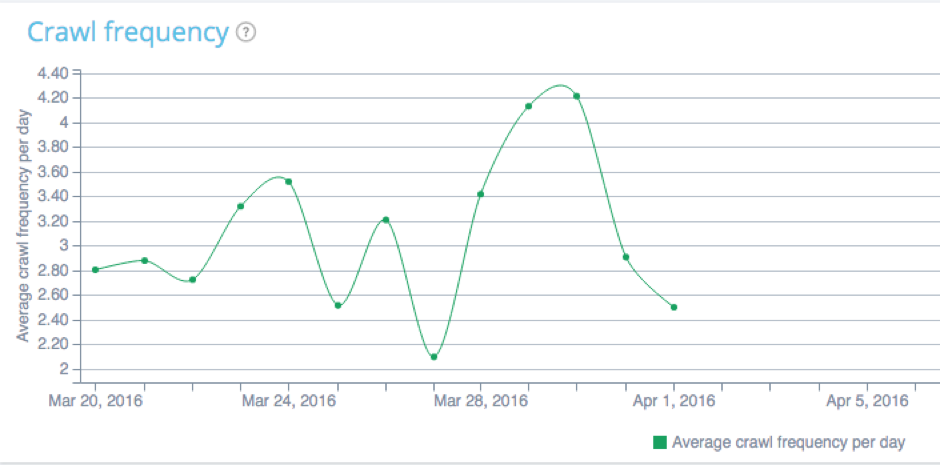
Logs also allow you to determine the volume of bot’s crawl or in other words the number of requests realized by Googlebot, Bingbot, Yahoo, Yandex or any other engines on a period of time. Crawl volume shows at which frequency a site has been visited. This metric helps watch if adding a new content has increased bots’ visits. A sudden decrease in crawl frequency can warn you about a possible change on the website that would have blocked these visits.
Errors in code responses
Logs data analysis can also help track errors in status codes like 4xx or 5xx that compromise SEO. Analyzing a website’s status codes also helps measuring their impact on bots hits and their frequency. Too many 404 errors will limit the crawler visit.
Crawl priority and active pages
Logs analysis can also help to determine the most popular pages to Google’s eyes and see which ones are less crawled. This information can thus help to know if it is the most important pages that are often visited by bots or not. This avoids ignoring some pages or sections of your website.
In fact, log analysis can highlight URLs or directories that are not often crawled by bots. For instance, if the user would like that a specific publication of his blog rank on a targeted query but which is located in a directory that Google only visits once a time every six months, he will miss chances to receive organic traffic from this publication for at least six months. If it is the case, he will know that it is necessary for instance to redefine his internal linking to push his “most valuable pages.”
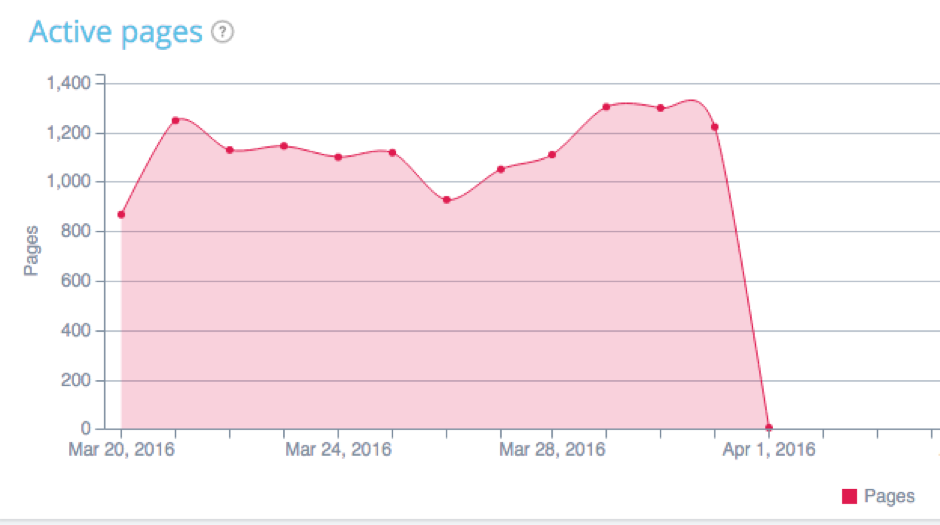
Log analysis can also help to know your most active pages or in other words, pages that receive the more SEO visits.
Resources crawling and waste of budget
Log analysis also helps you determine how your crawl budget is spent within your types of files. Does Google spend too much time crawling images for example?
A crawl budget refers to the number of pages a search engine will crawl each time it visits your site. This budget is linked to the authority of the domain, the sanity of your website and is proportional to the flow of link equity through the website.
Actually, this crawl budget could be wasted to irrelevant pages. Imagine you have a budget of 100 units per day, then you want these 100 units to be spent on important pages.
If bots meet too many negative factors on your website, they won’t come back that often and you will have wasted your crawl budget on useless pages. If you have fresh content you want to be indexed but no budget left, then Google won’t index it.
That’s why you want to watch where you spend your crawl budget with log analysis and optimize your website to increase bot’s visits.
Last crawl date
Log file analysis tells when Google has crawled a particular page for the last time and that the user would like to quickly index.
Log File Analysis: Do It For Free
You can use an open source log analyzer to audit you SEO like the OnCrawl ELK one. It will help you spot:
- Unique pages crawled by Google
- Crawl frequency by group of pages
- Monitor status codes
- Spot active and inactive pages.
For instance, if you have a website hosted on OVH and you have set up your logs in order to make them distinct by host types, here is the process:
1: Install Docker
Install Docker Tool Box
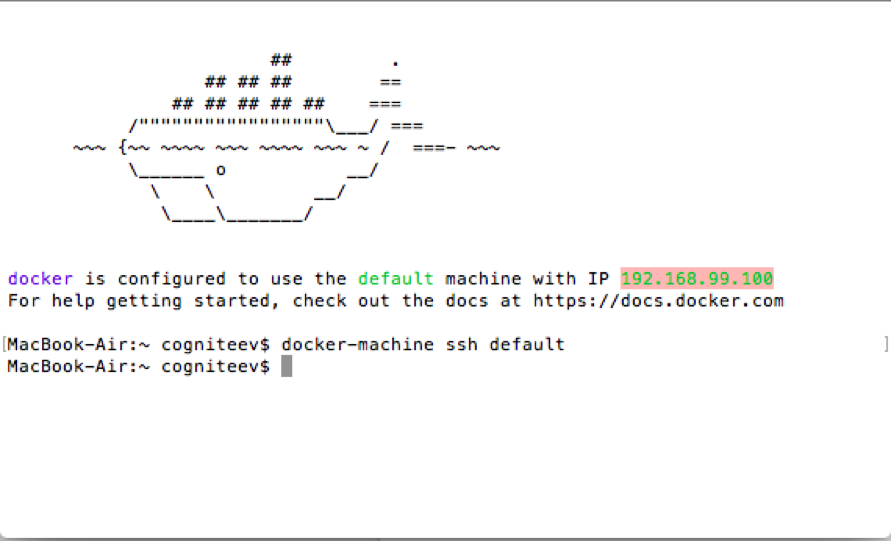
Choose Docker Quickstart terminal to start
Copy/paste the IP address 192.168.99.100
Download oncrawl-elk release: https://github.com/cogniteev/oncrawl-elk/archive/1.1.zip
Add these lines to create a directory and unzip the file :
MacBook-Air:~ cogniteev$ mkdir oncrawl-elk
MacBook-Air:~ cogniteev$ cd oncrawl-elk/
MacBook-Air:oncrawl-elk cogniteev$ unzip ~/Downloads/oncrawl-elk-1.1.zip
And then:
MacBook-Air:oncrawl-elk cogniteev$ cd oncrawl-elk-1.1/
MacBook-Air:oncrawl-elk-1.1 cogniteev$ docker-compose -f docker-compose.yml up -d
Docker-compose will download all necessary images from docker hub, this may take a few minutes. Once the docker container has started, you can enter the following address in your browser: http://DOCKER-IP:9000. Make sure to replace DOCKER-IP with the IP you copied earlier.
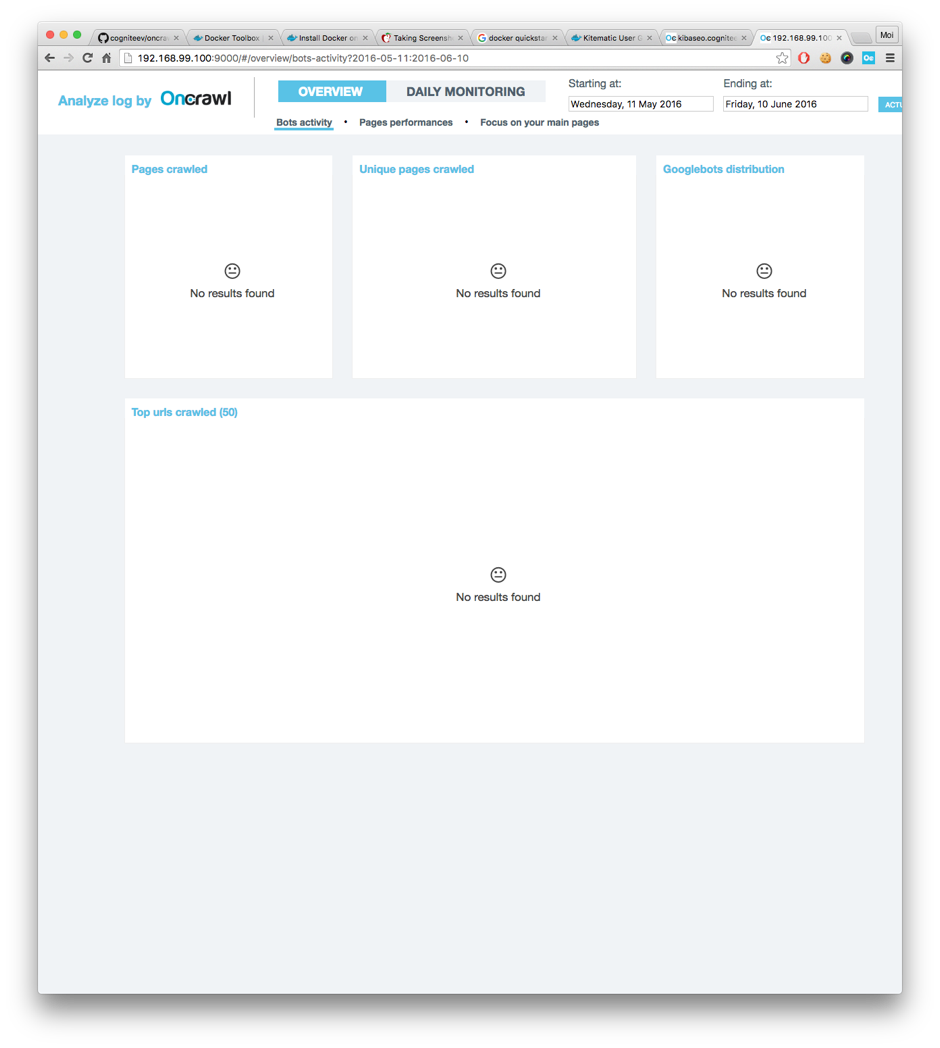
You should see the OnCrawl-ELK dashboard, but there is no data yet. Let's bring some data to analyze.
2: Import log files
Importing data is as easy as copying log access files to the right folder. Logstash starts indexing any file found at logs/apache/*.log , logs/nginx/*.log , automatically.
Apache/Nginx logs
If your webserver is powered by Apache or NGinx, make sure the format is combined log format. They should look like:
127.0.0.1 - - [28/Aug/2015:06:45:41 +0200] "GET /apache_pb.gif HTTP/1.0" 200 2326 "http://www.example.com/start.html" "Mozilla/5.0 (compatible; Googlebot/2.1; +http://www.google.com/bot.html)"
Drop your .log files into the logs/apache or logs/nginx directory accordingly.
3: Play
Go back to http://DOCKER-IP:9000. You should have figures and graphs. Congrats!
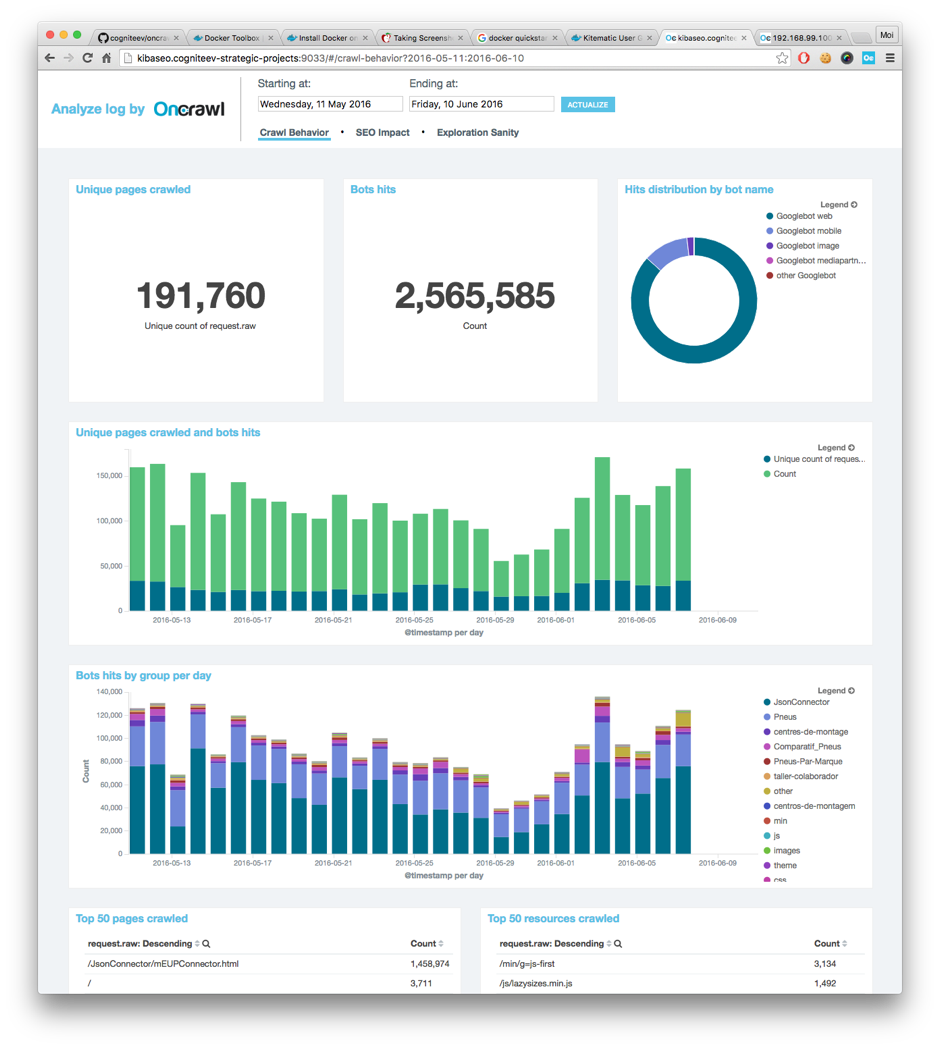
You can now start using the free open source log analyzer and daily monitor your SEO performance. Please leave a comment if you have any questions. Let us know how it's worked out for you.
